Mapping Software for
Sales TeamsFranchisesReal EstateLogisticsMarketersRetailersField TeamsSales Teams
Maptive puts your data on a map fast, with 60+ features and no learning curve. Just upload your spreadsheet to create a map today.
No credit card required
Trusted by teams at


Powerful & Easy to Learn
If you have data and want to see it on a map, Maptive is here to make that easier. You can build your first map in minutes, and as you go, the features are there to help you shape it into exactly what you need, all included with your subscription.
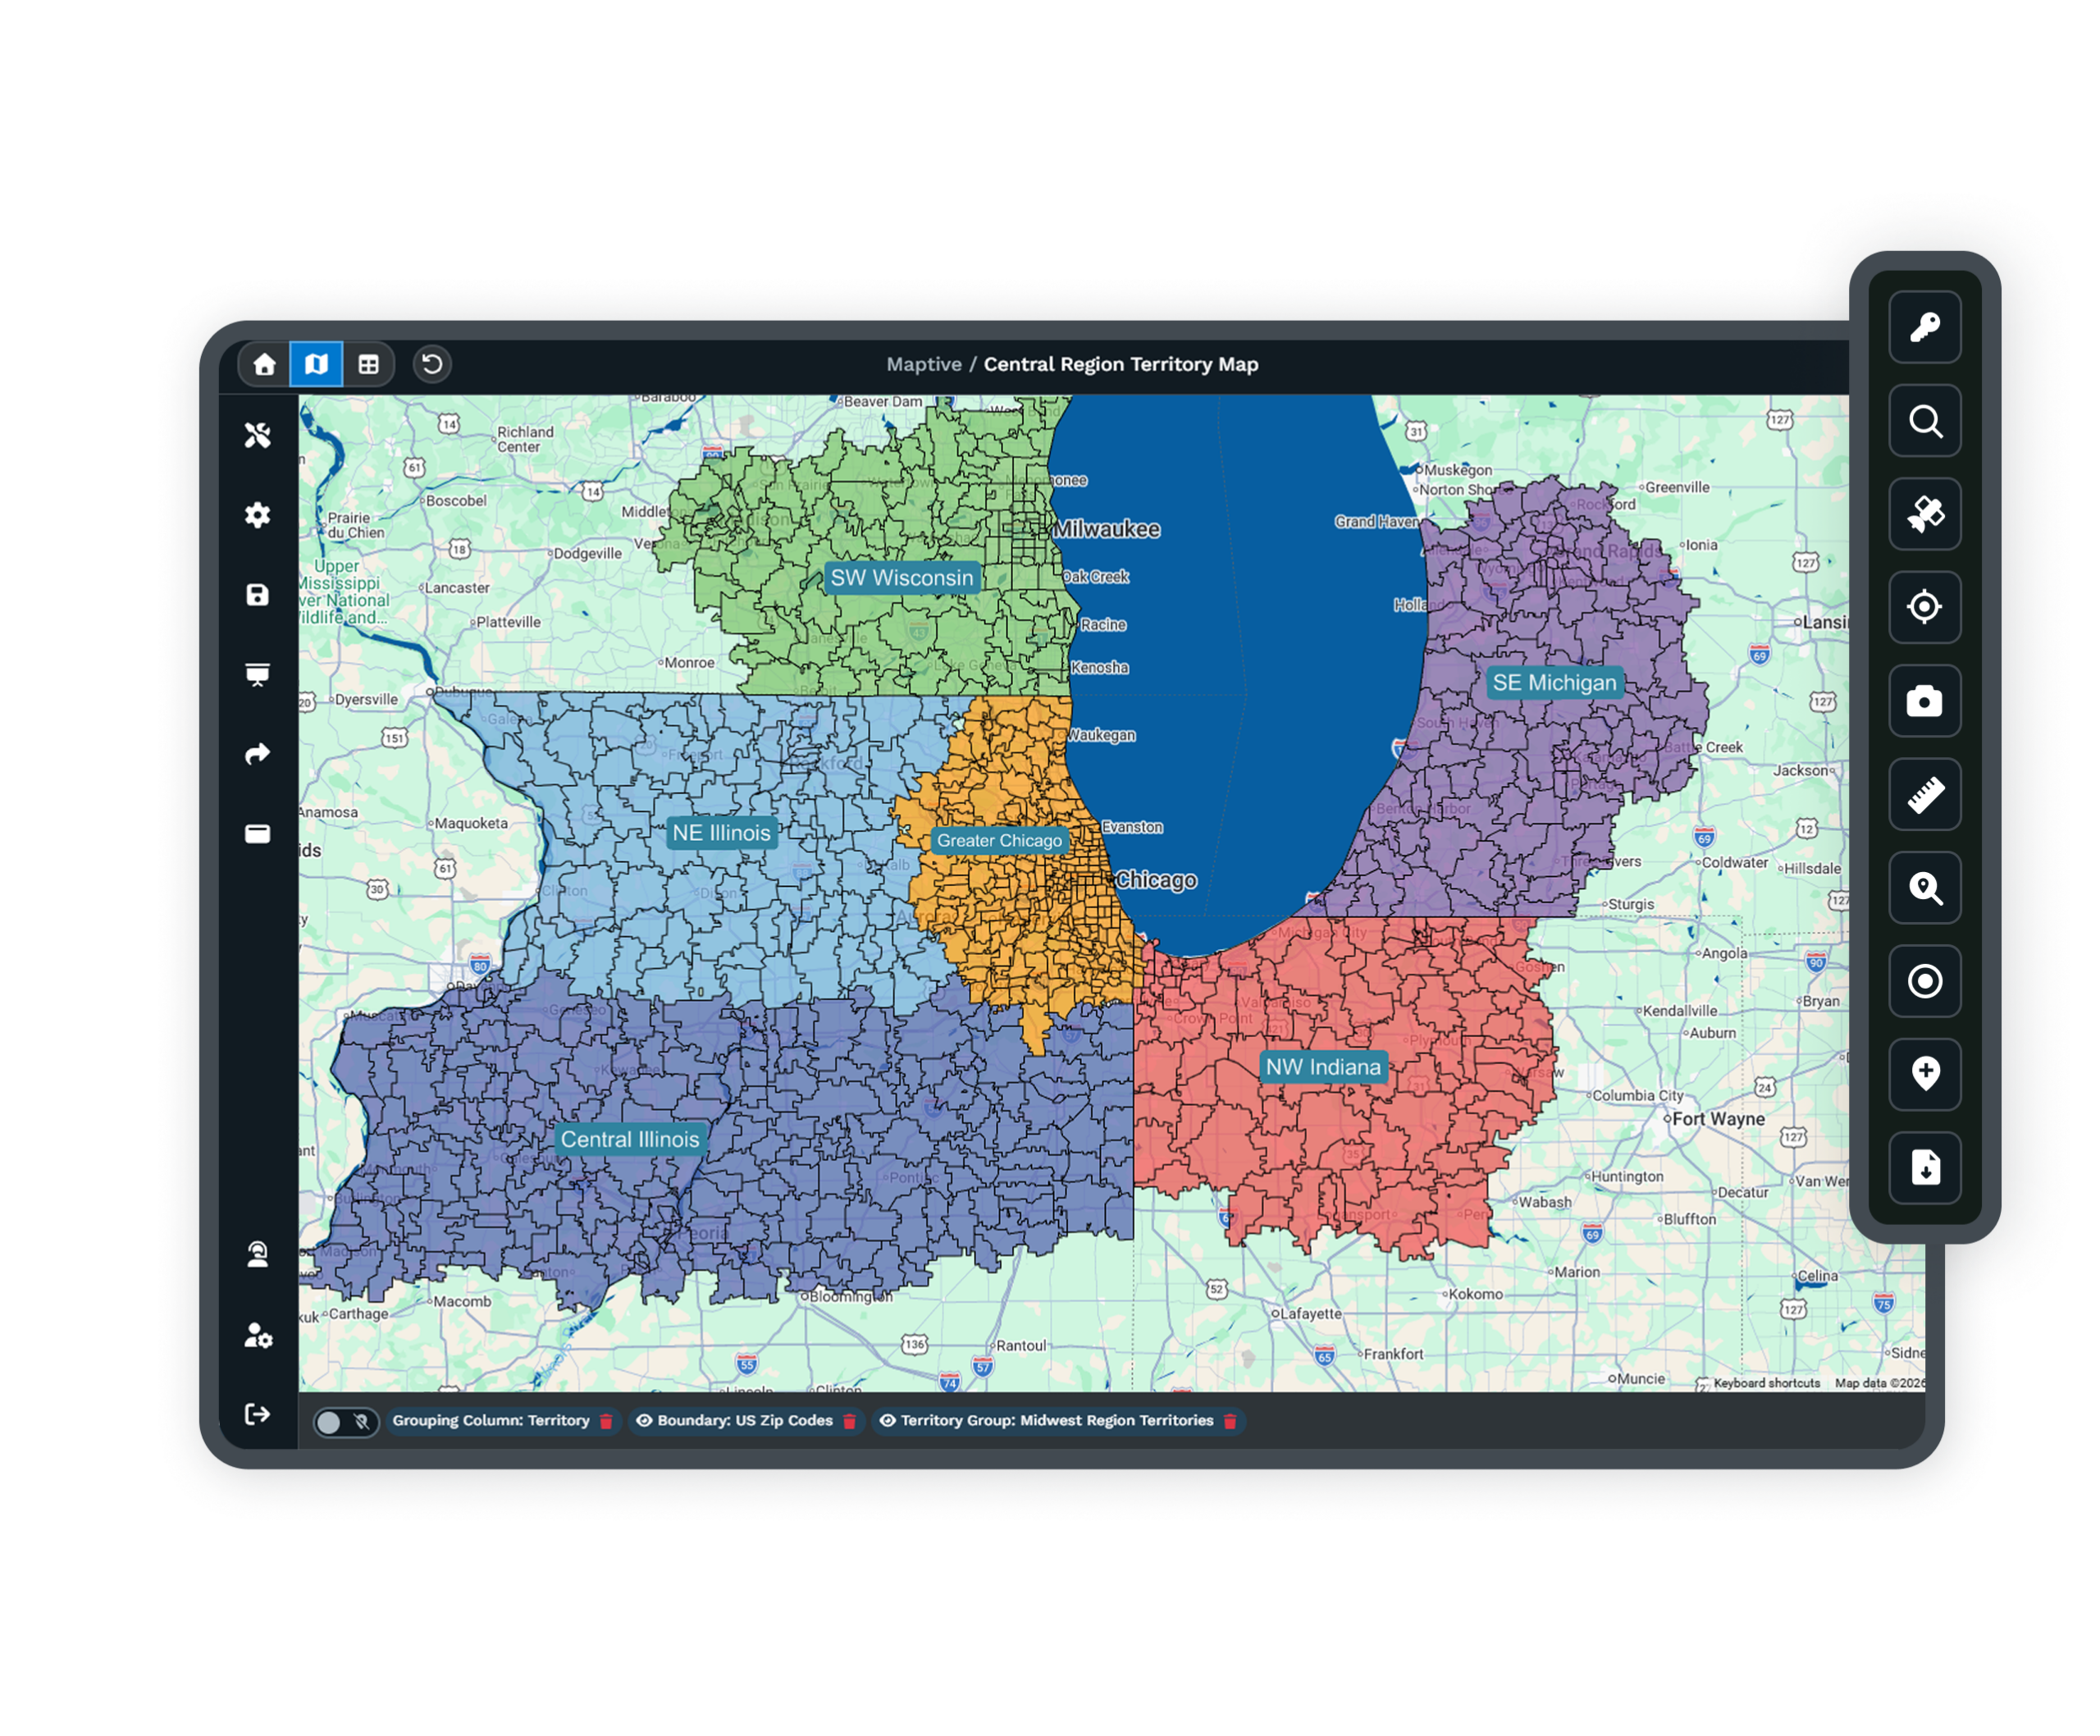
Territory Management
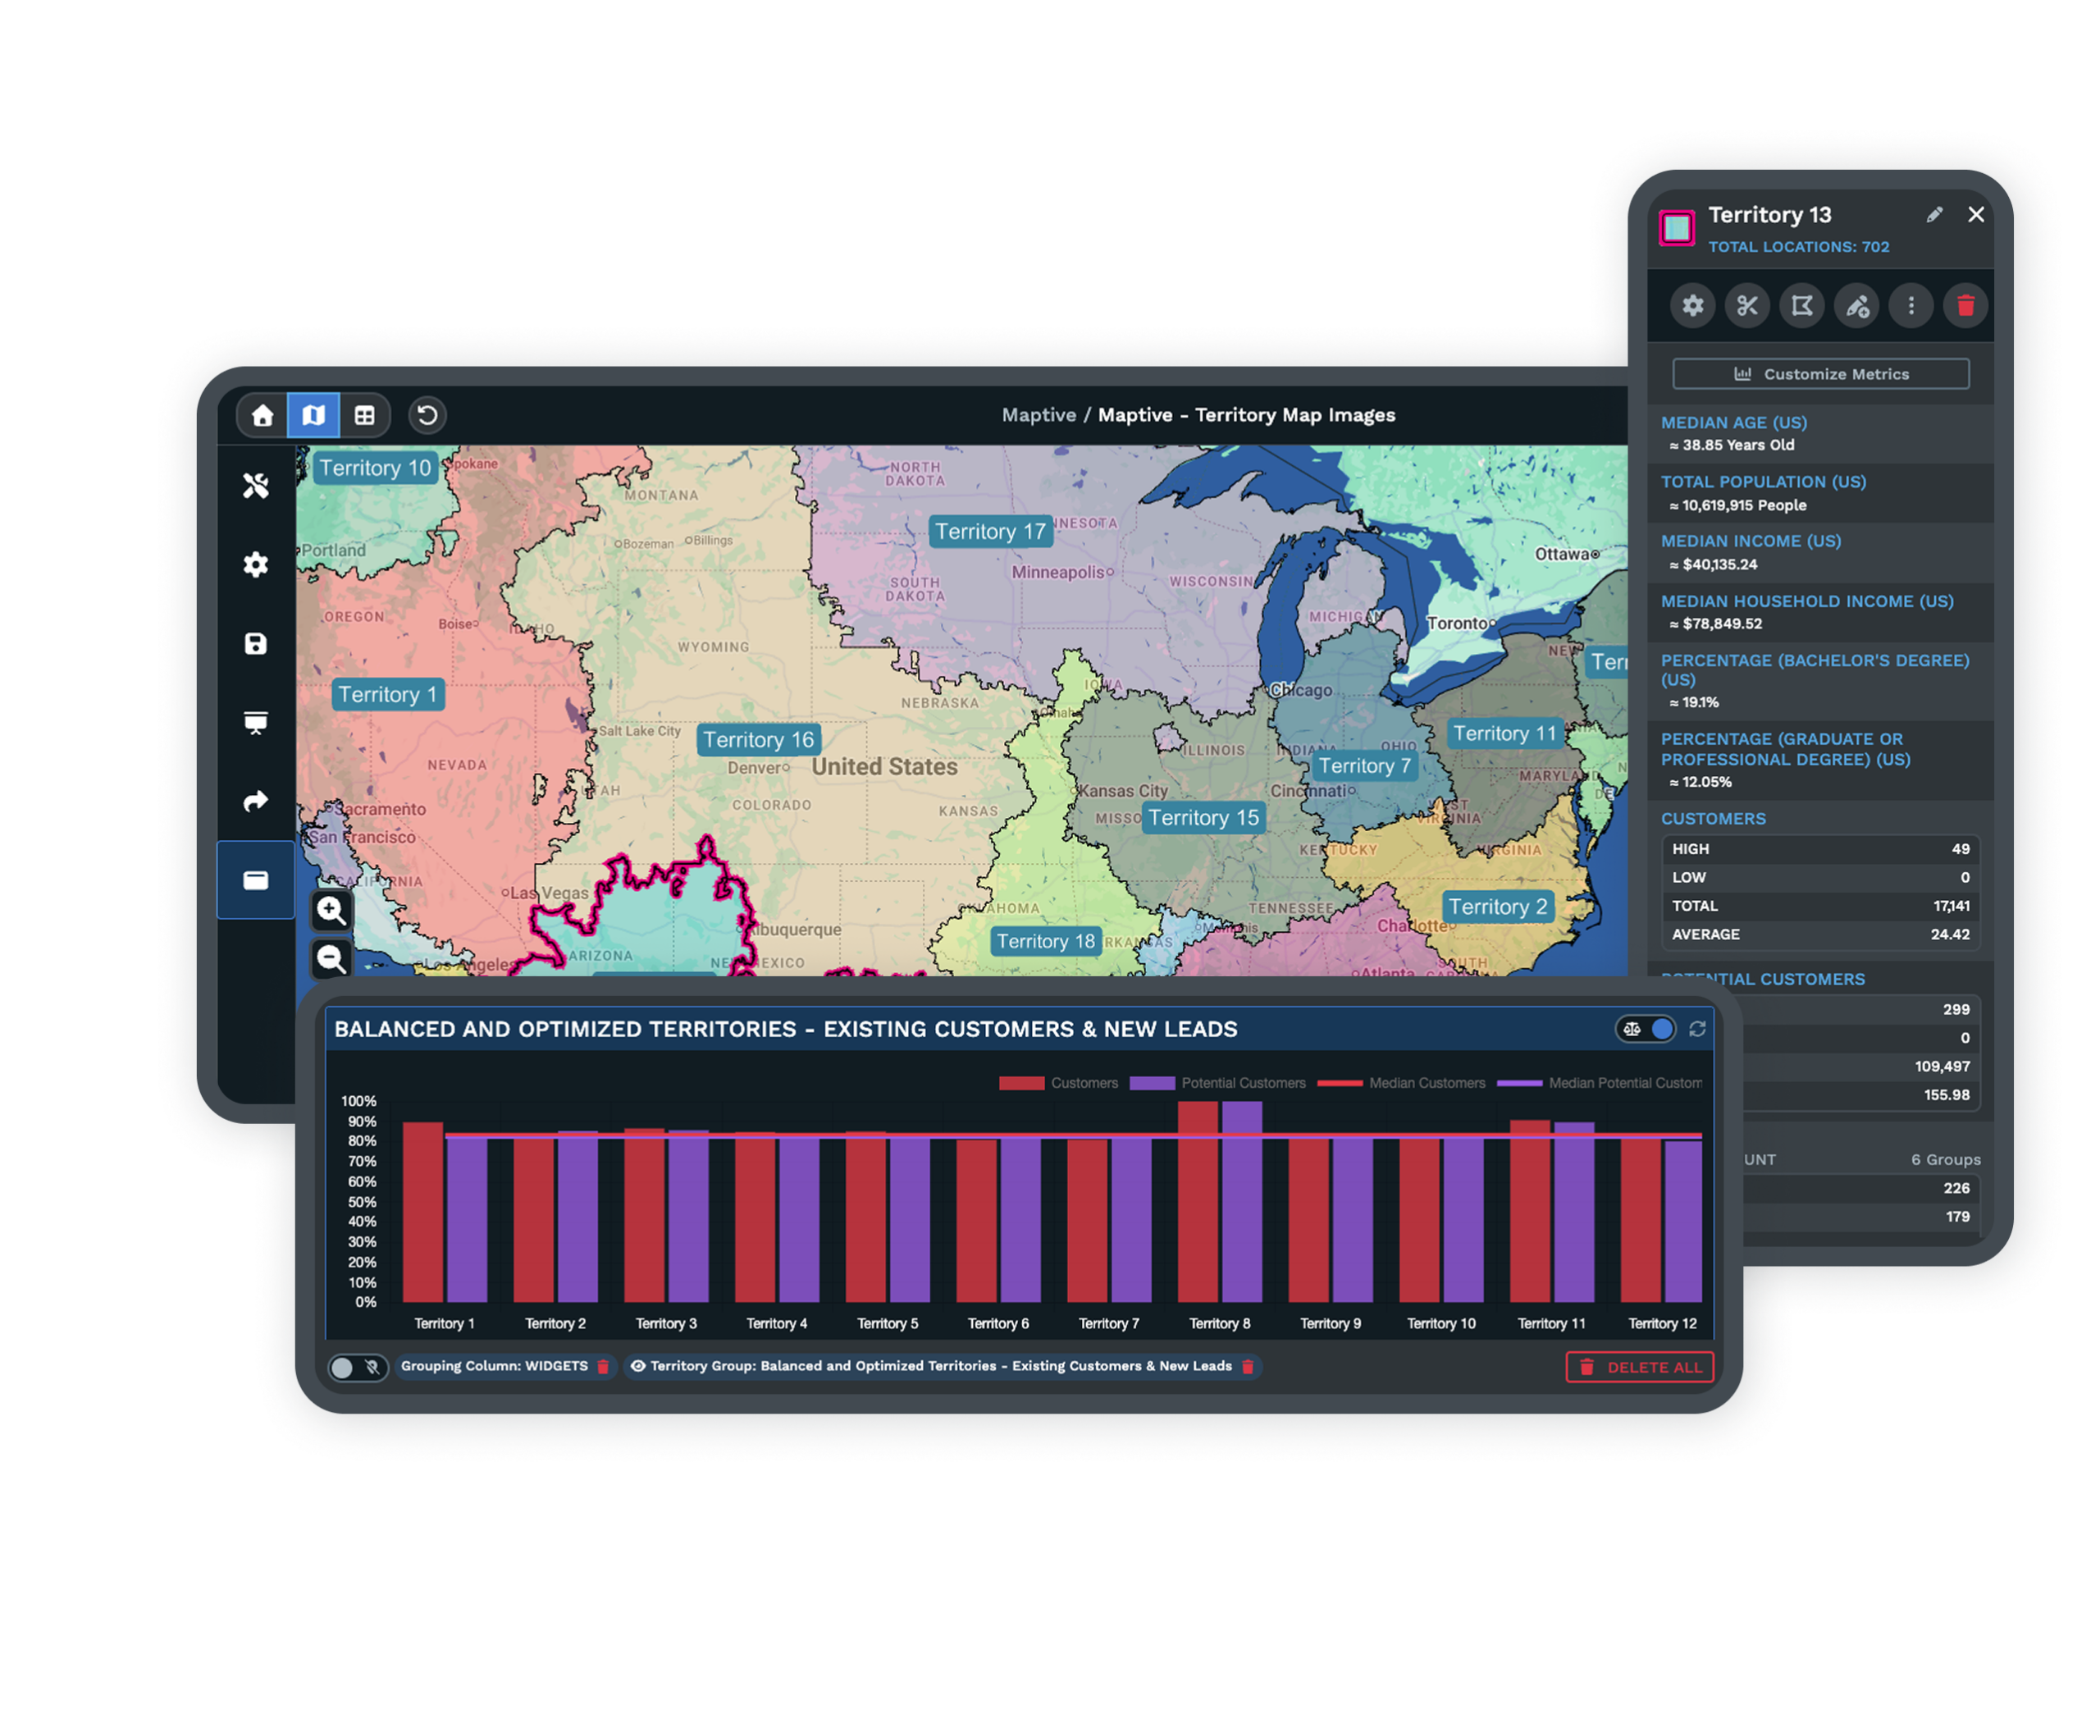
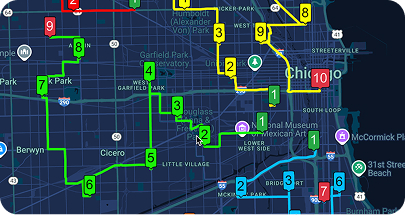
Territory Management Without the Complexity
Territory management software draws new boundaries from real volume and coverage data, so the work splits fairly across reps, branches, or franchisees. Build from a spreadsheet or from states, counties, ZIP codes, and tracts, then drag to rebalance.
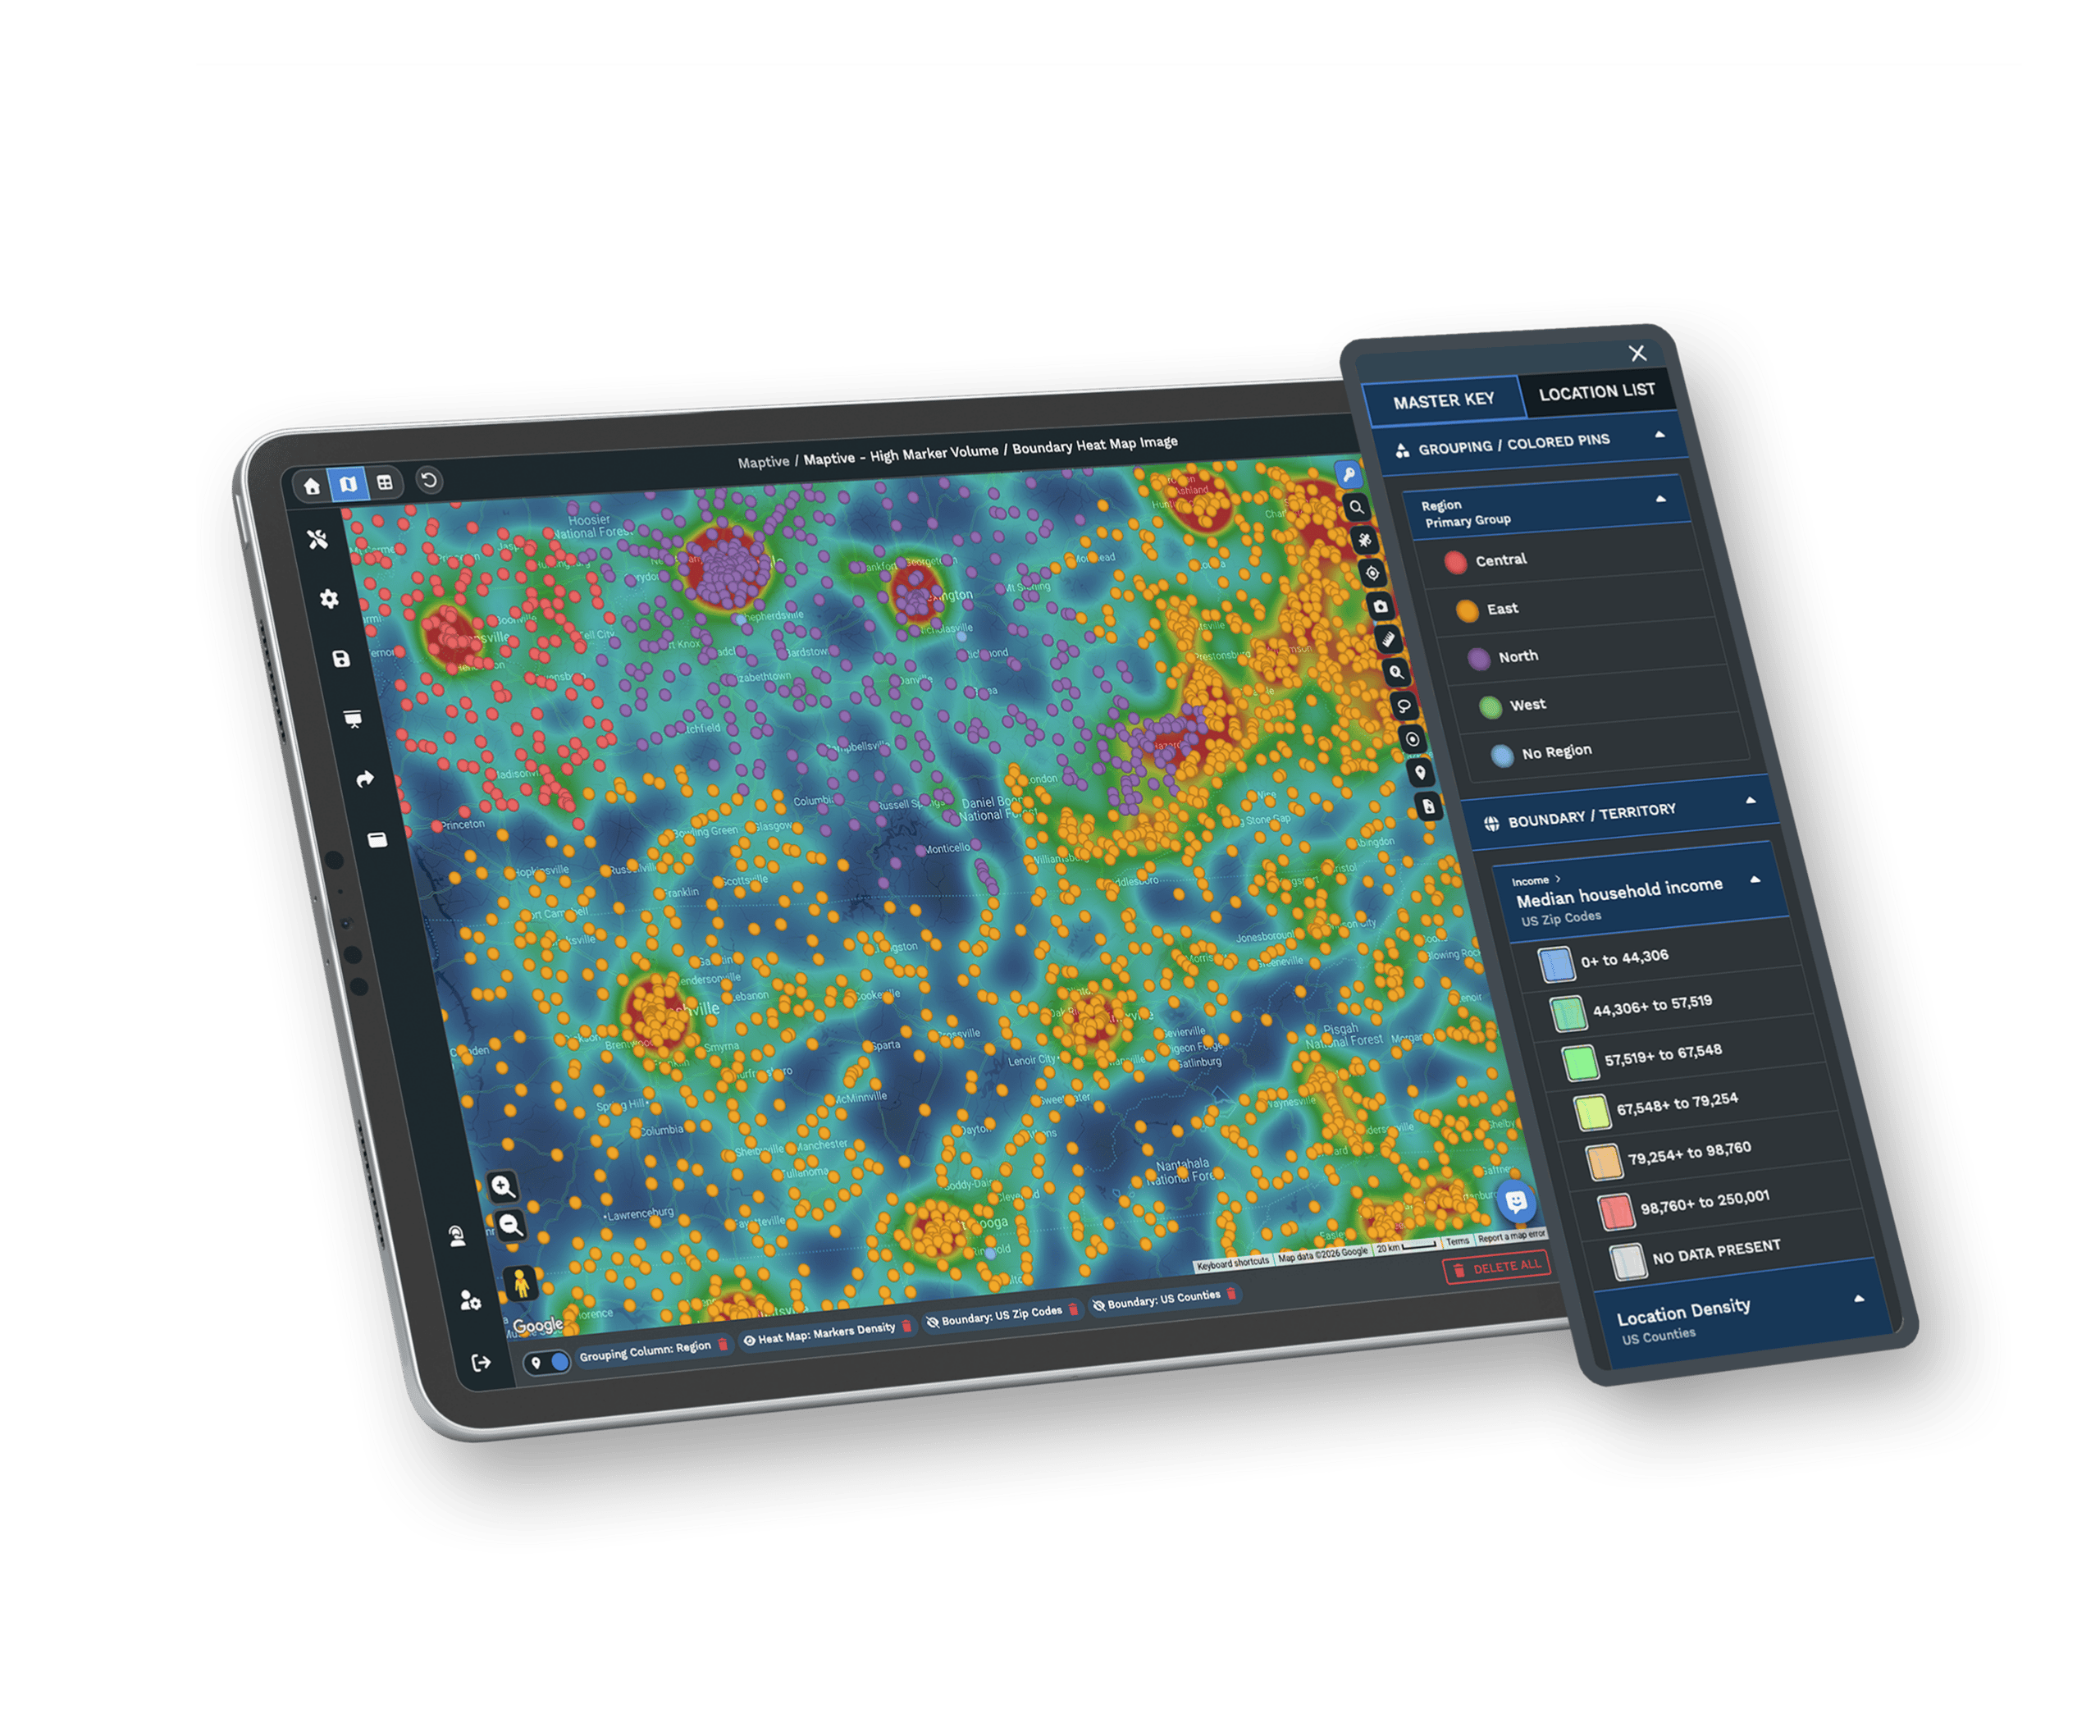
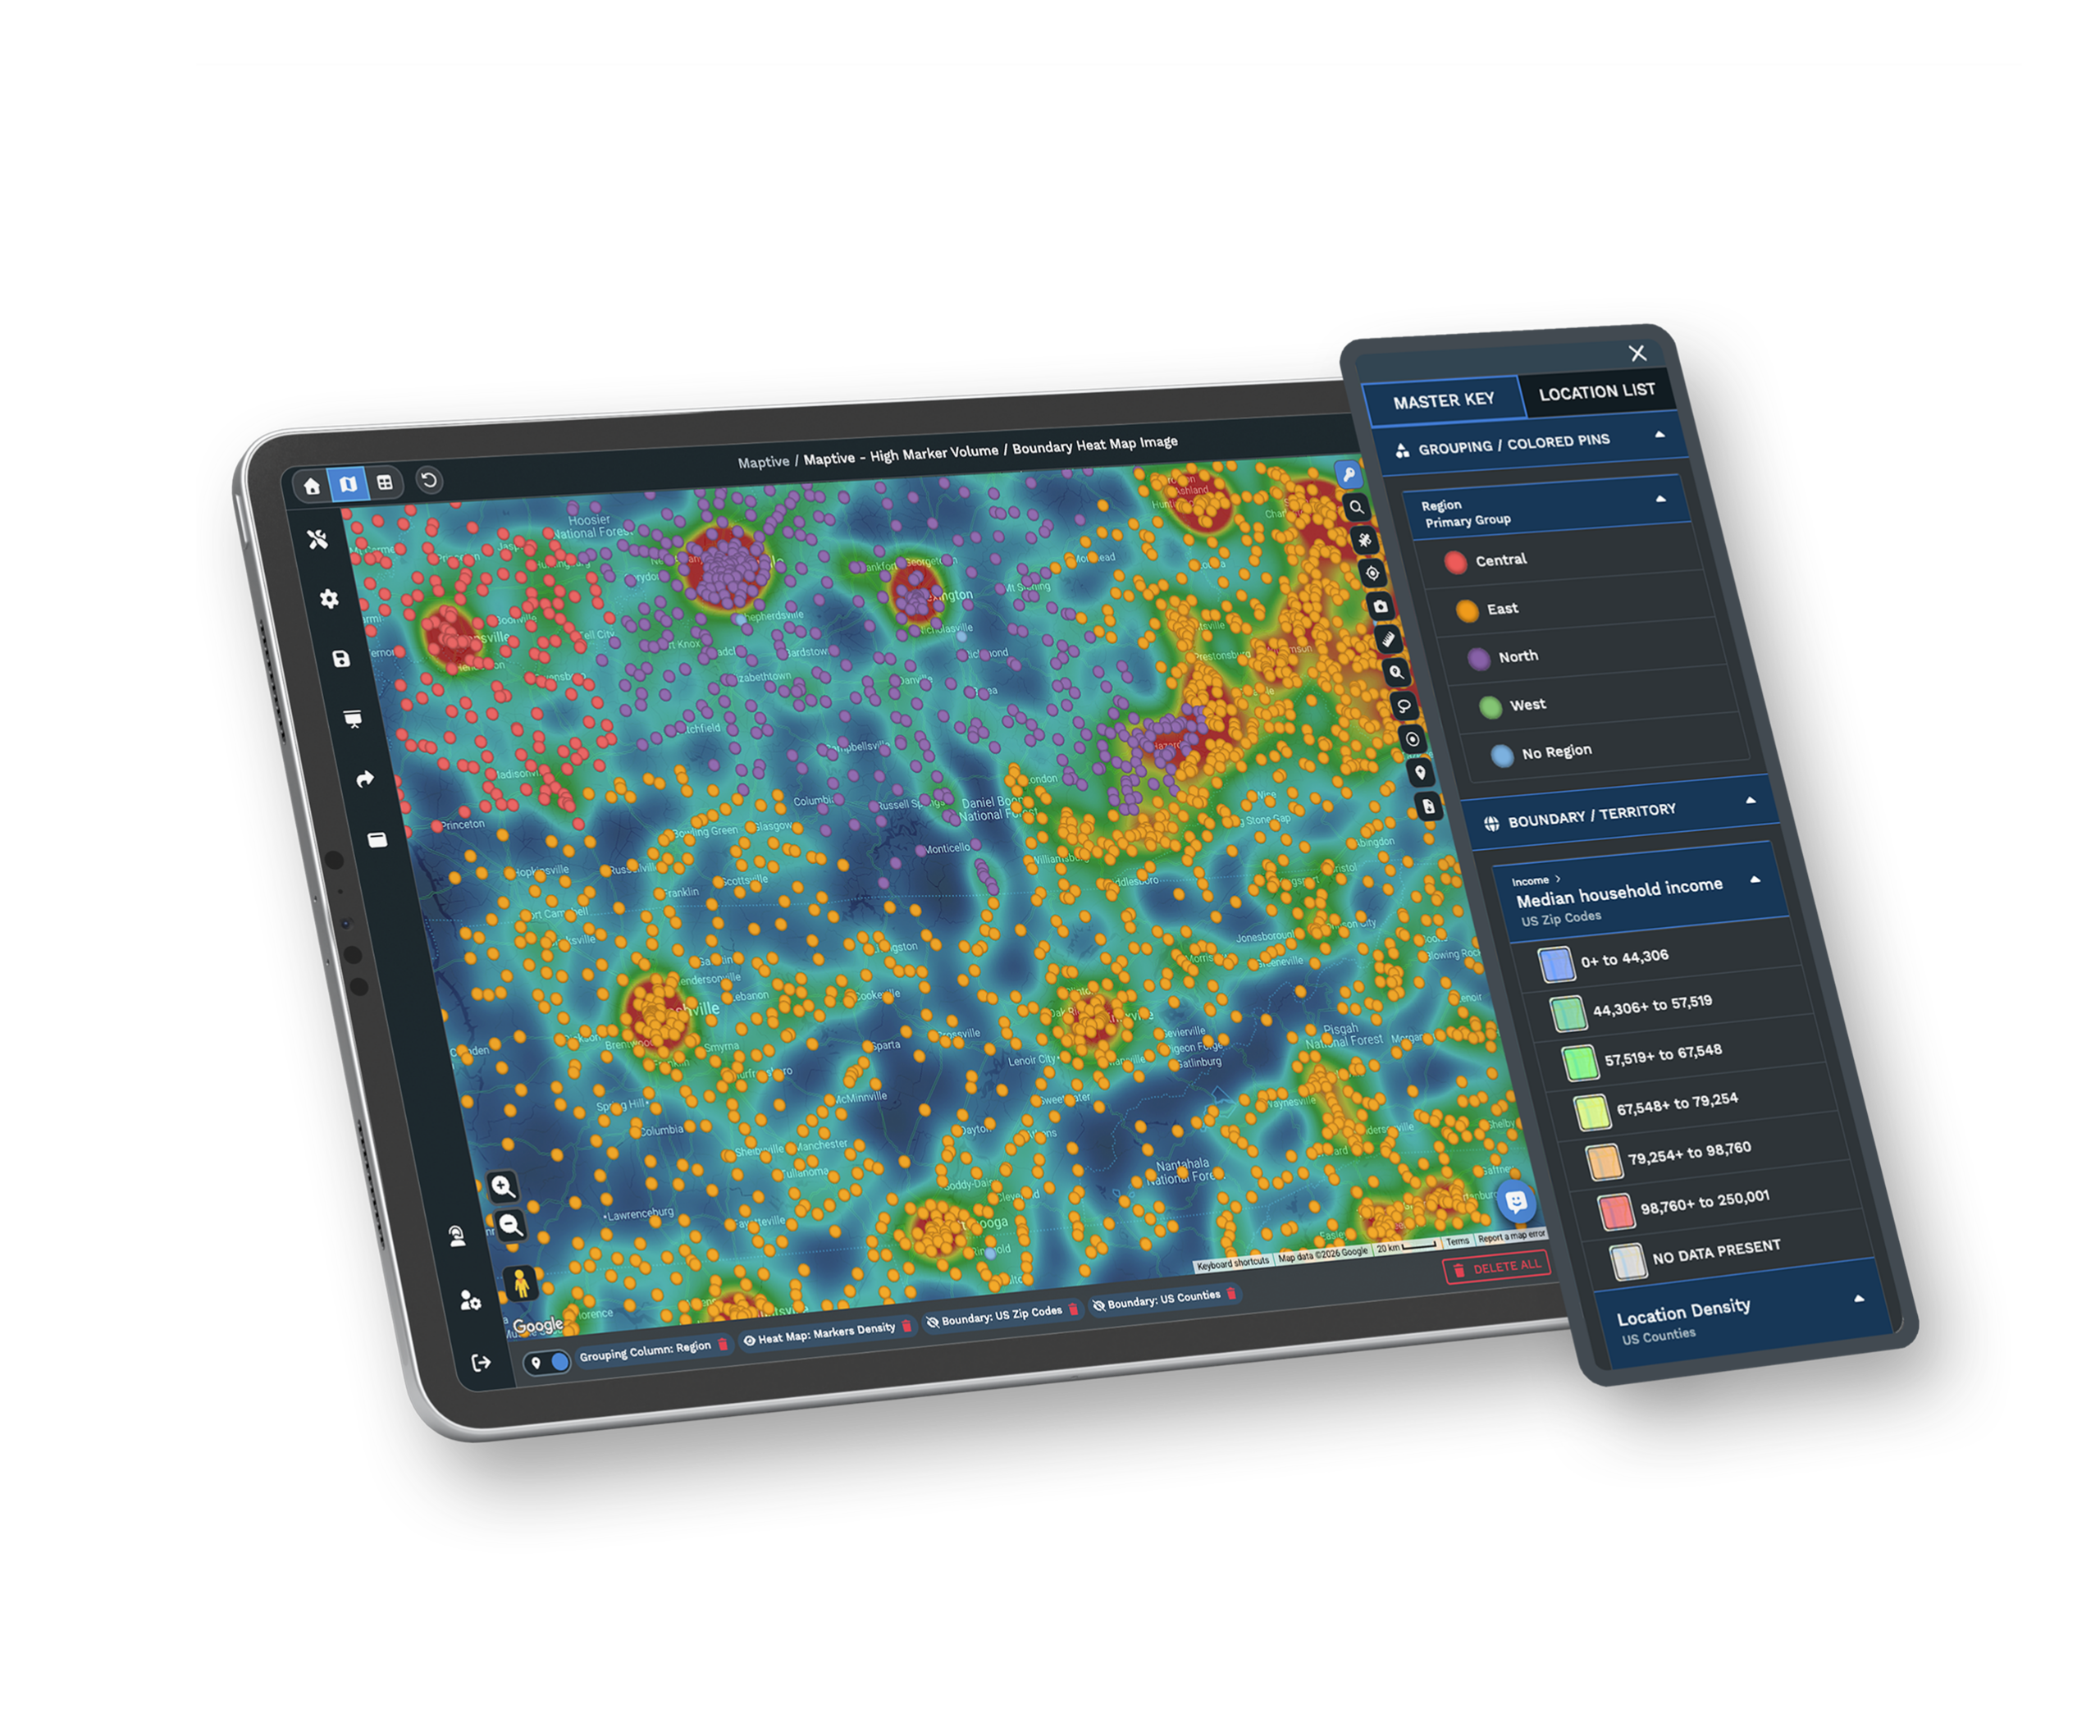
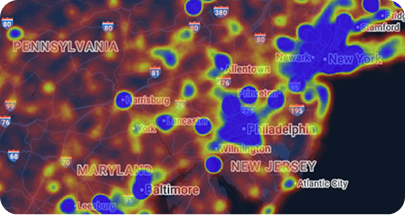
Heat Mapping
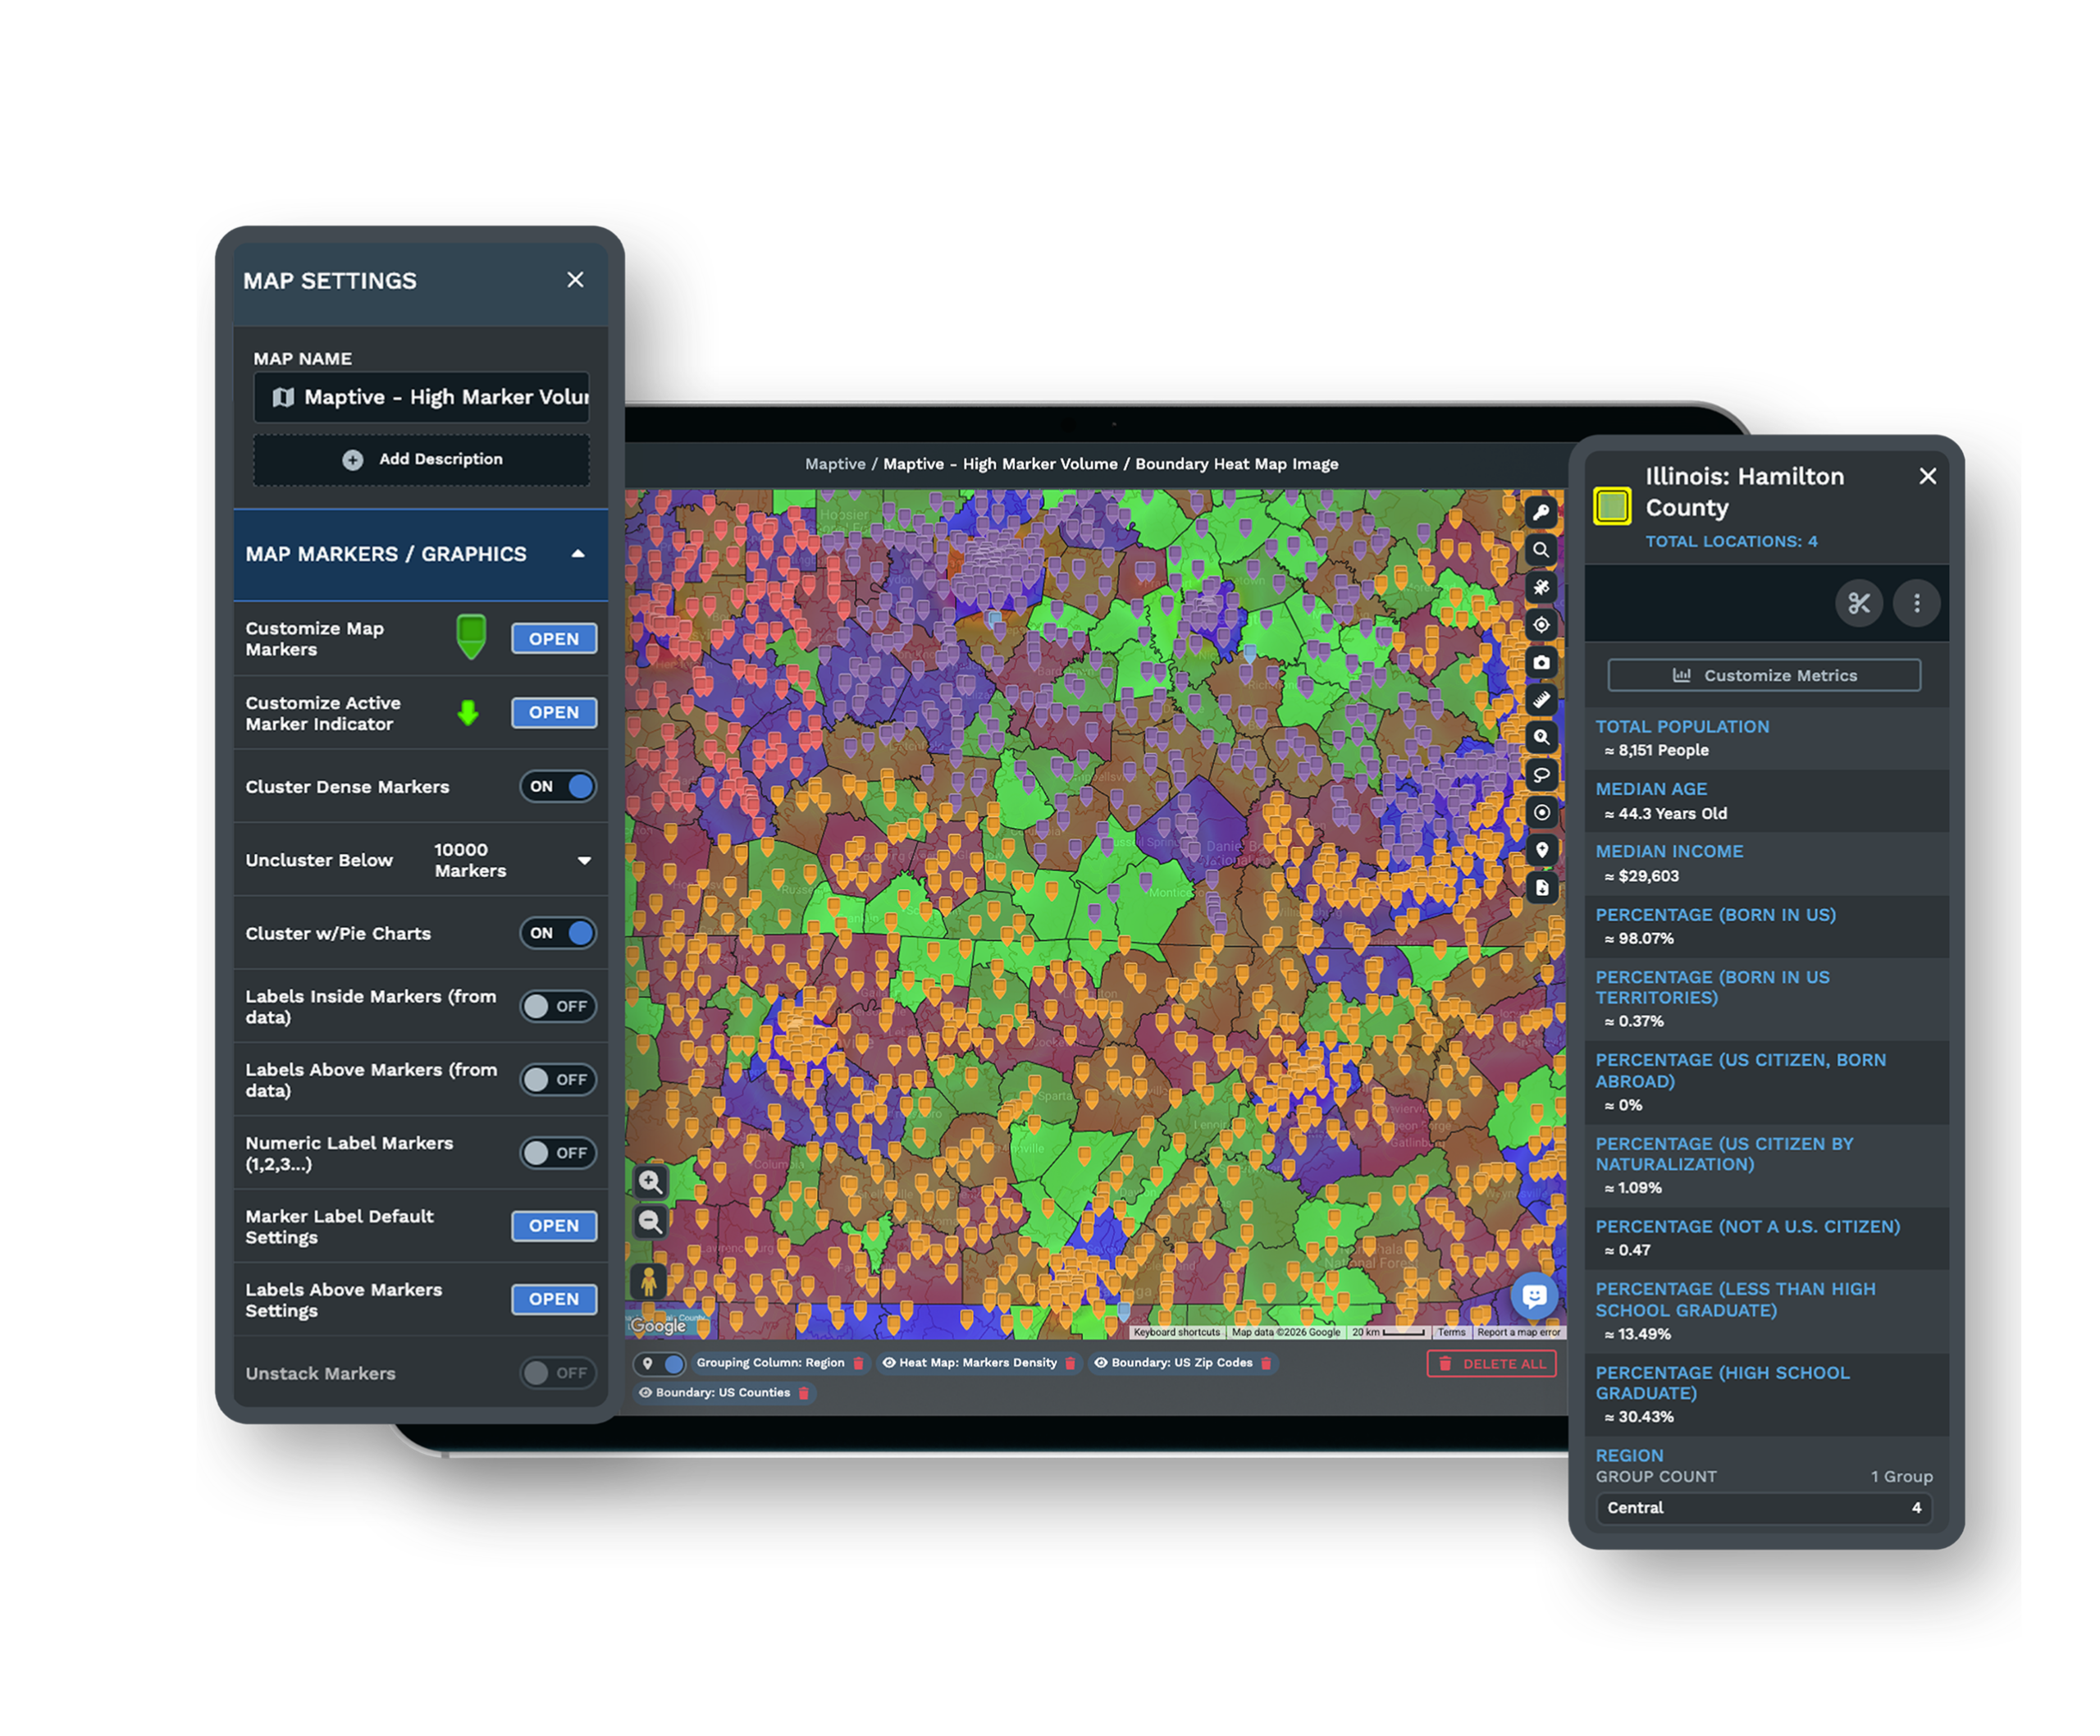
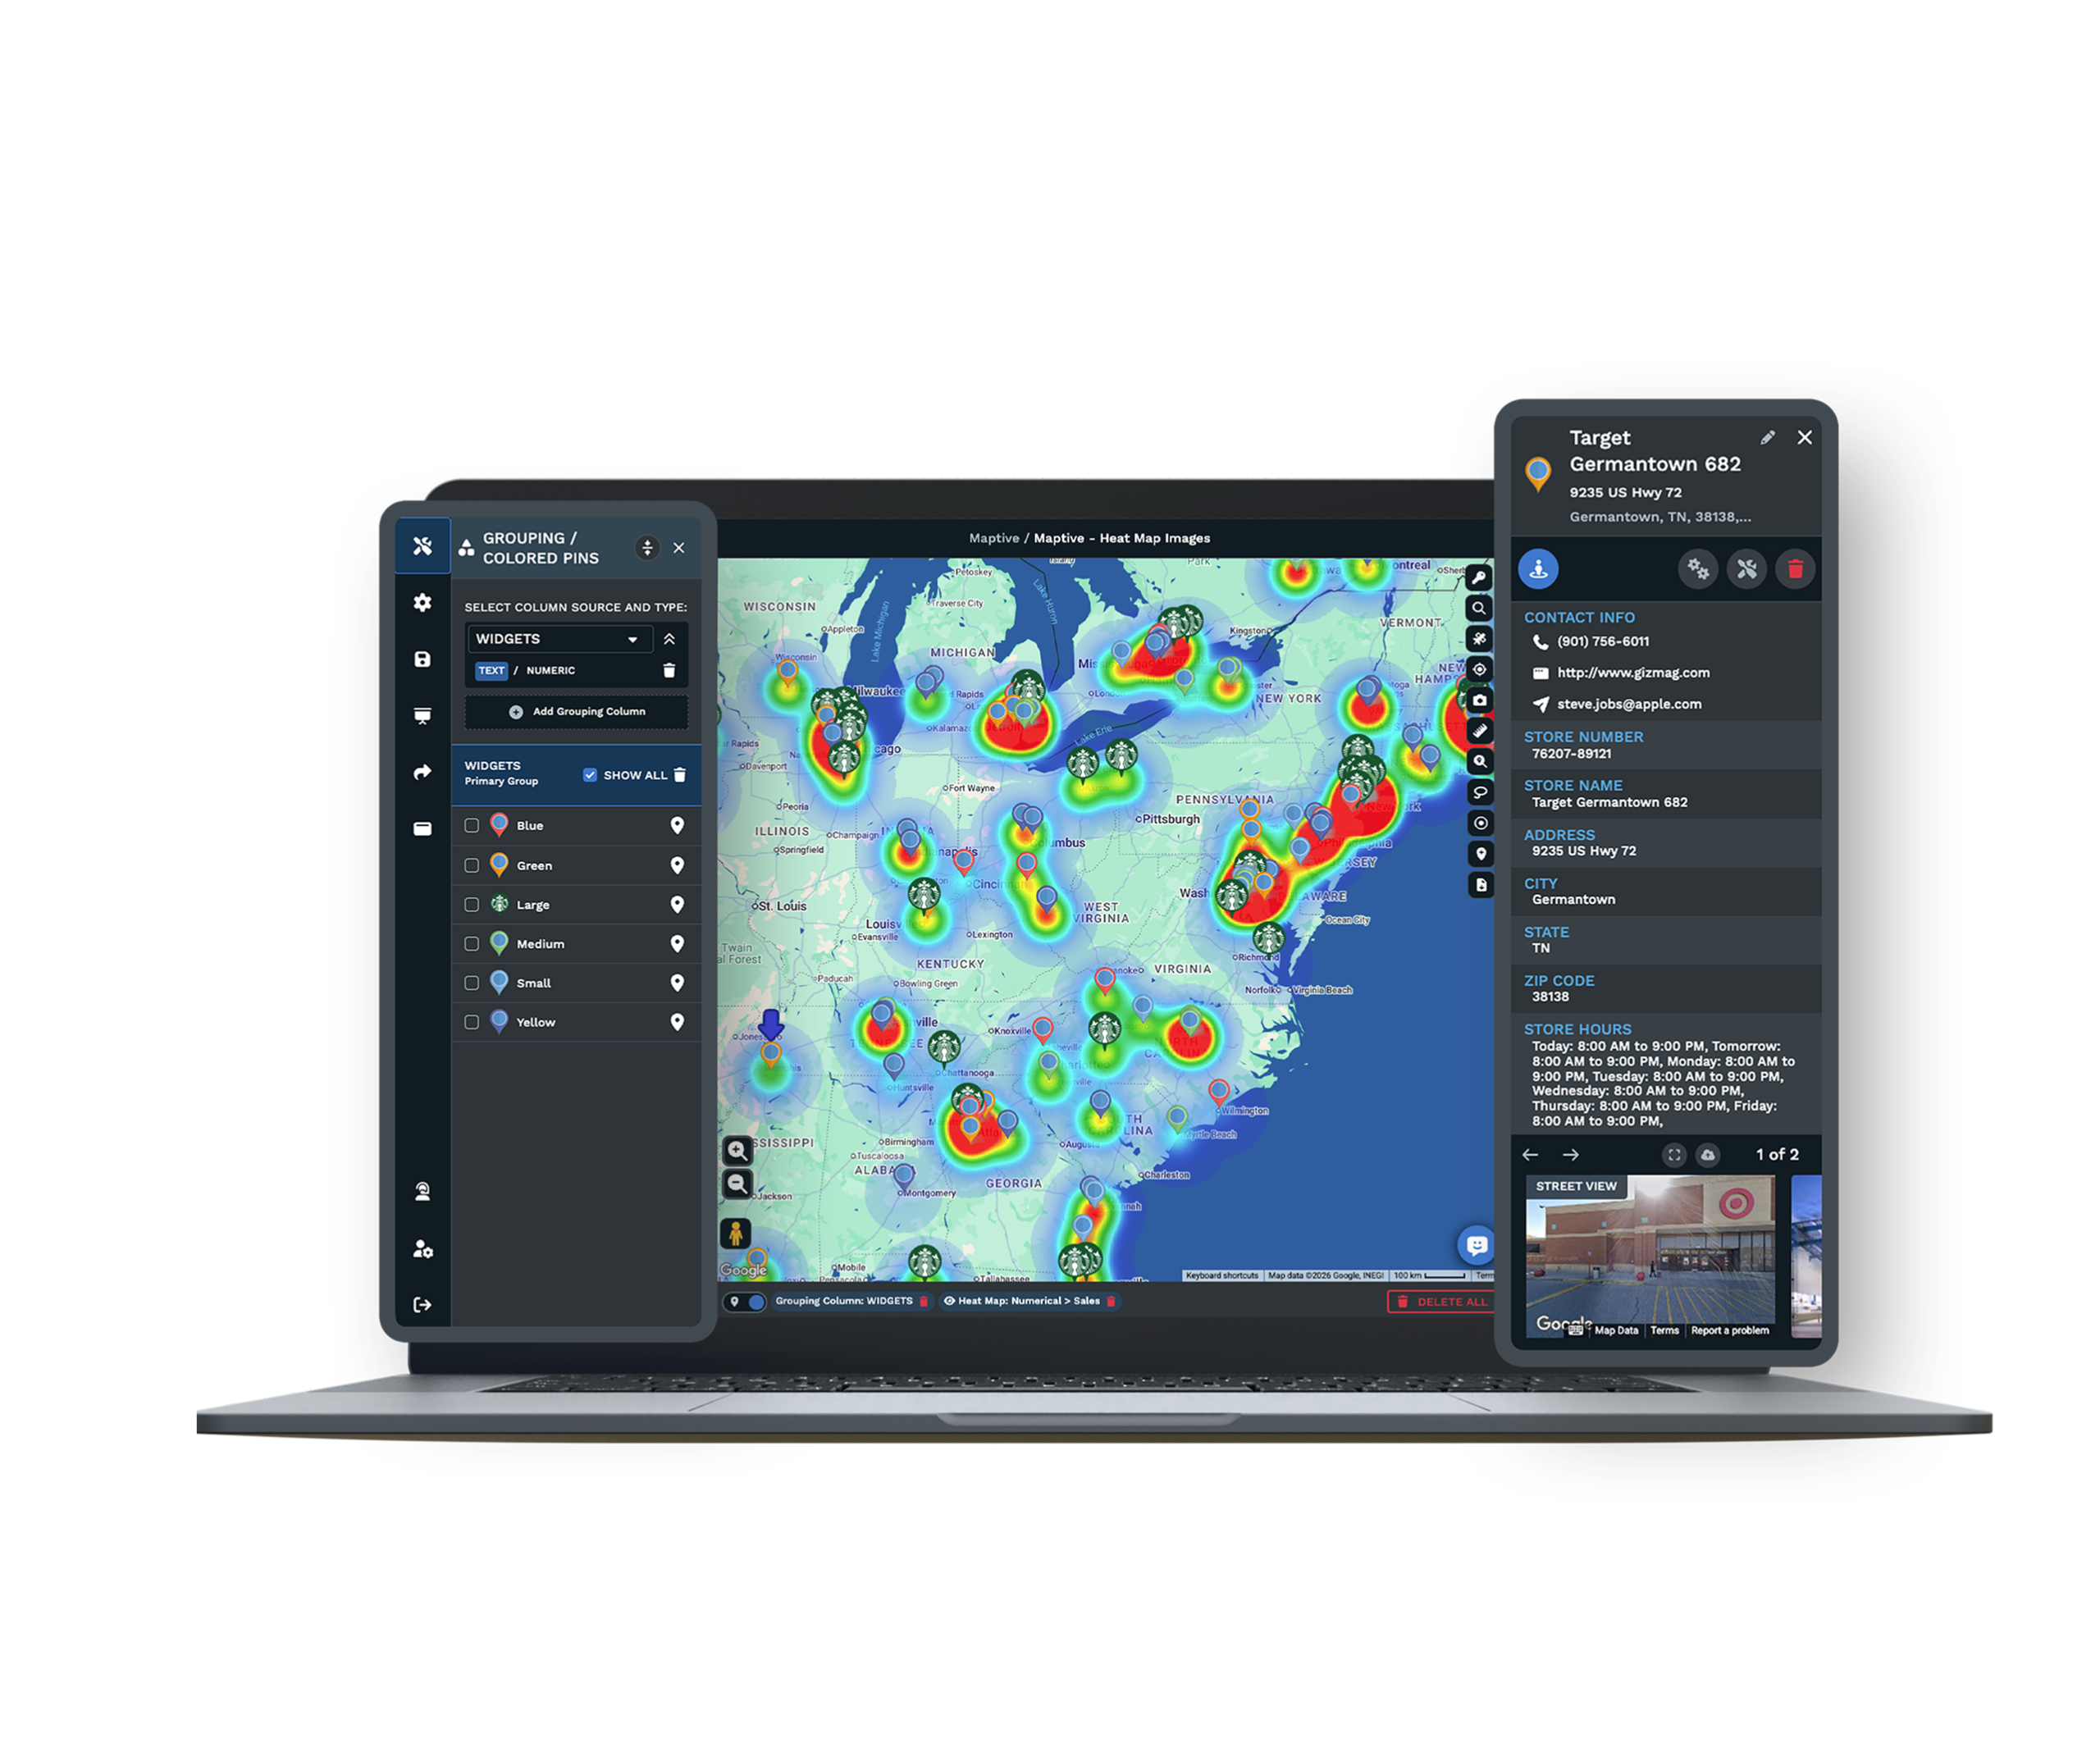
Build Heat Maps From Your Data
The heat map maker turns any numeric column into a weighted heat map in two clicks. Weight by sales volume, account count, or any field you upload, then tune radius, opacity, and intensity until the patterns your team has been missing are obvious.
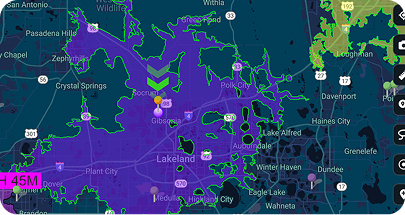
Drive-Time & Demographics
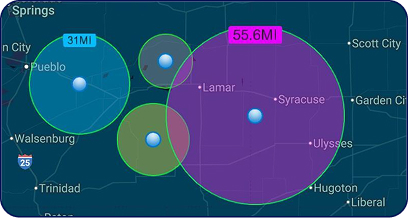
Drive-Time Polygons & Demographic Overlays, Built In
Drive-time polygons trace real road networks to visualize how far a sales rep can drive in 25 minutes. Underneath, demographic overlays bring 50+ Census variables down to the block group around every pin.
Locations & Customers
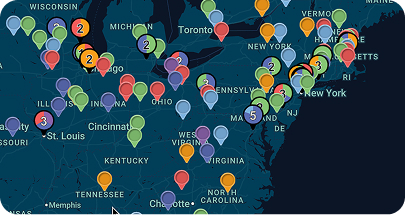
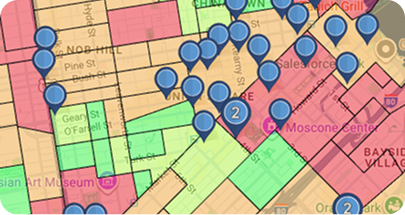
Map Your Business & Customers
See your locations and customers on the same map with different colored pins. Find out how many live within 5 miles of each store and what percentage of sales those customers represent.
Explore the toolkit
Mapping Features You Can Count On
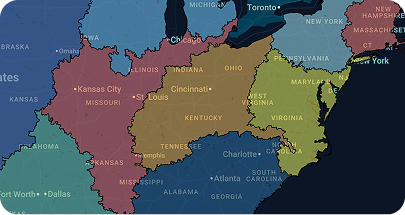
Create Sales Territories
Build sales territories with custom boundaries or zip codes, then aggregate sales and demographic data to guide smarter planning.
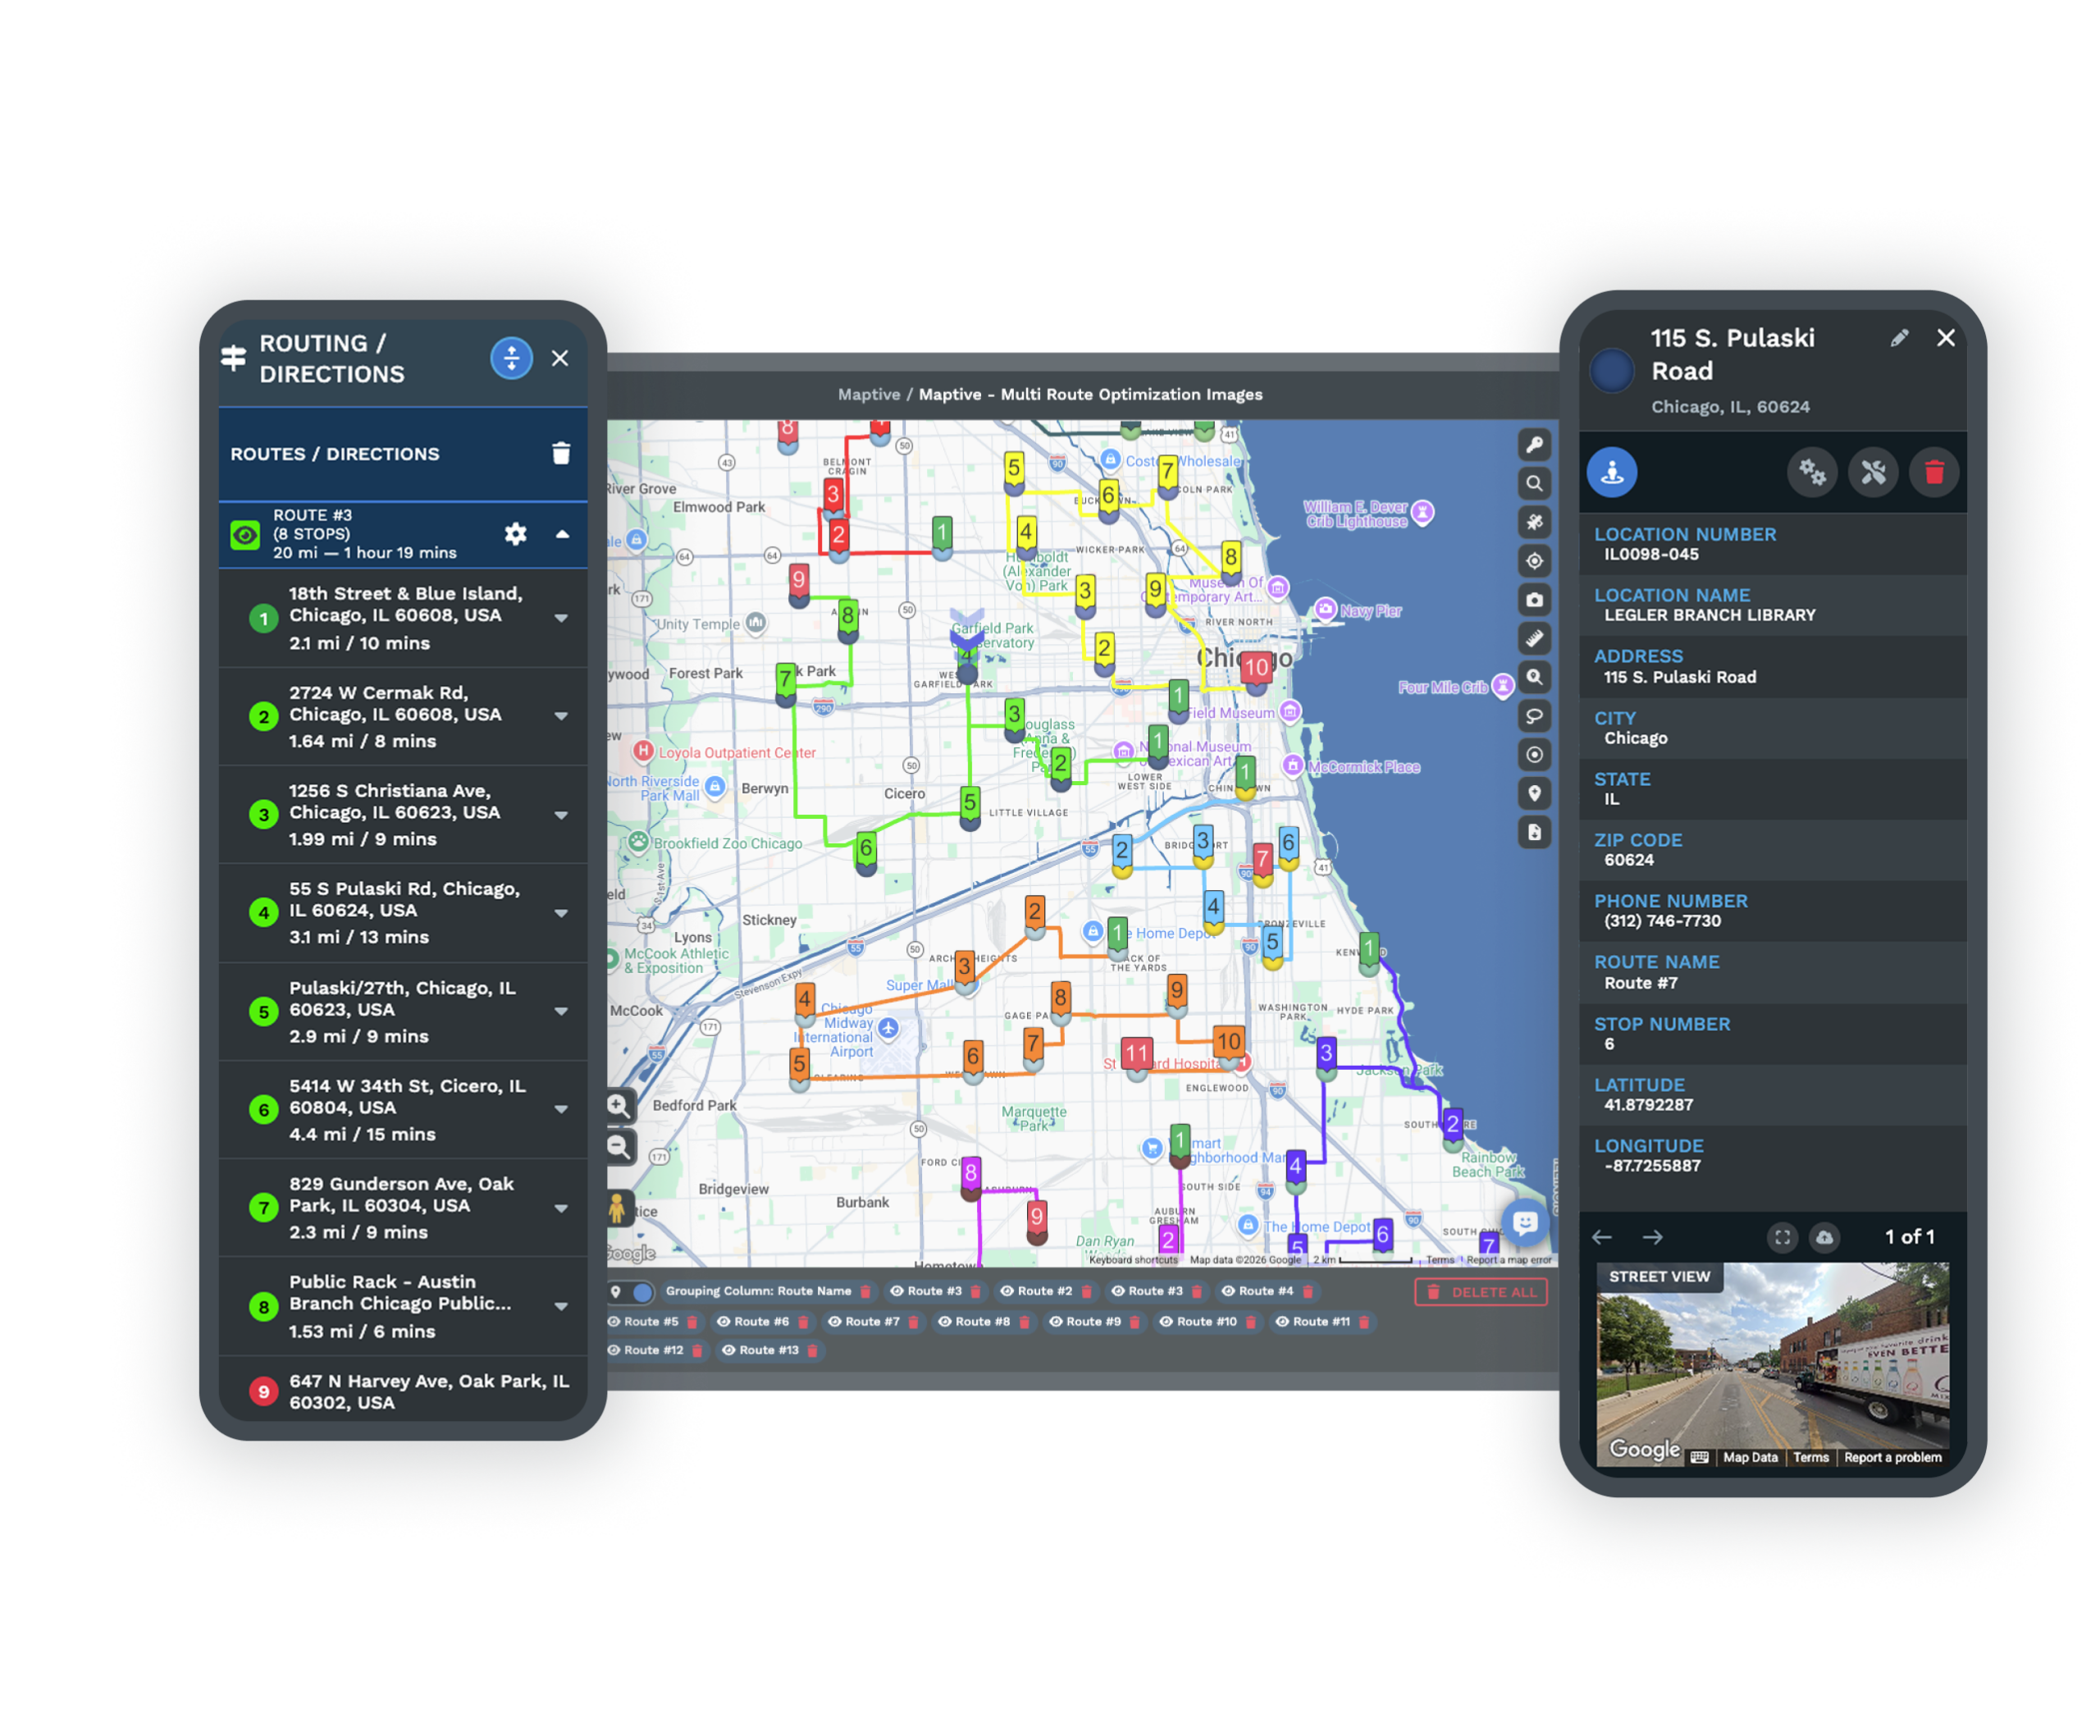
Route Optimization
Save time with optimized routes across up to 73 stops, complete with exportable turn-by-turn navigation for field teams and drivers.
Map Radius Tool
Define areas with a simple radius, then export locations or send them directly into route planning and directions.
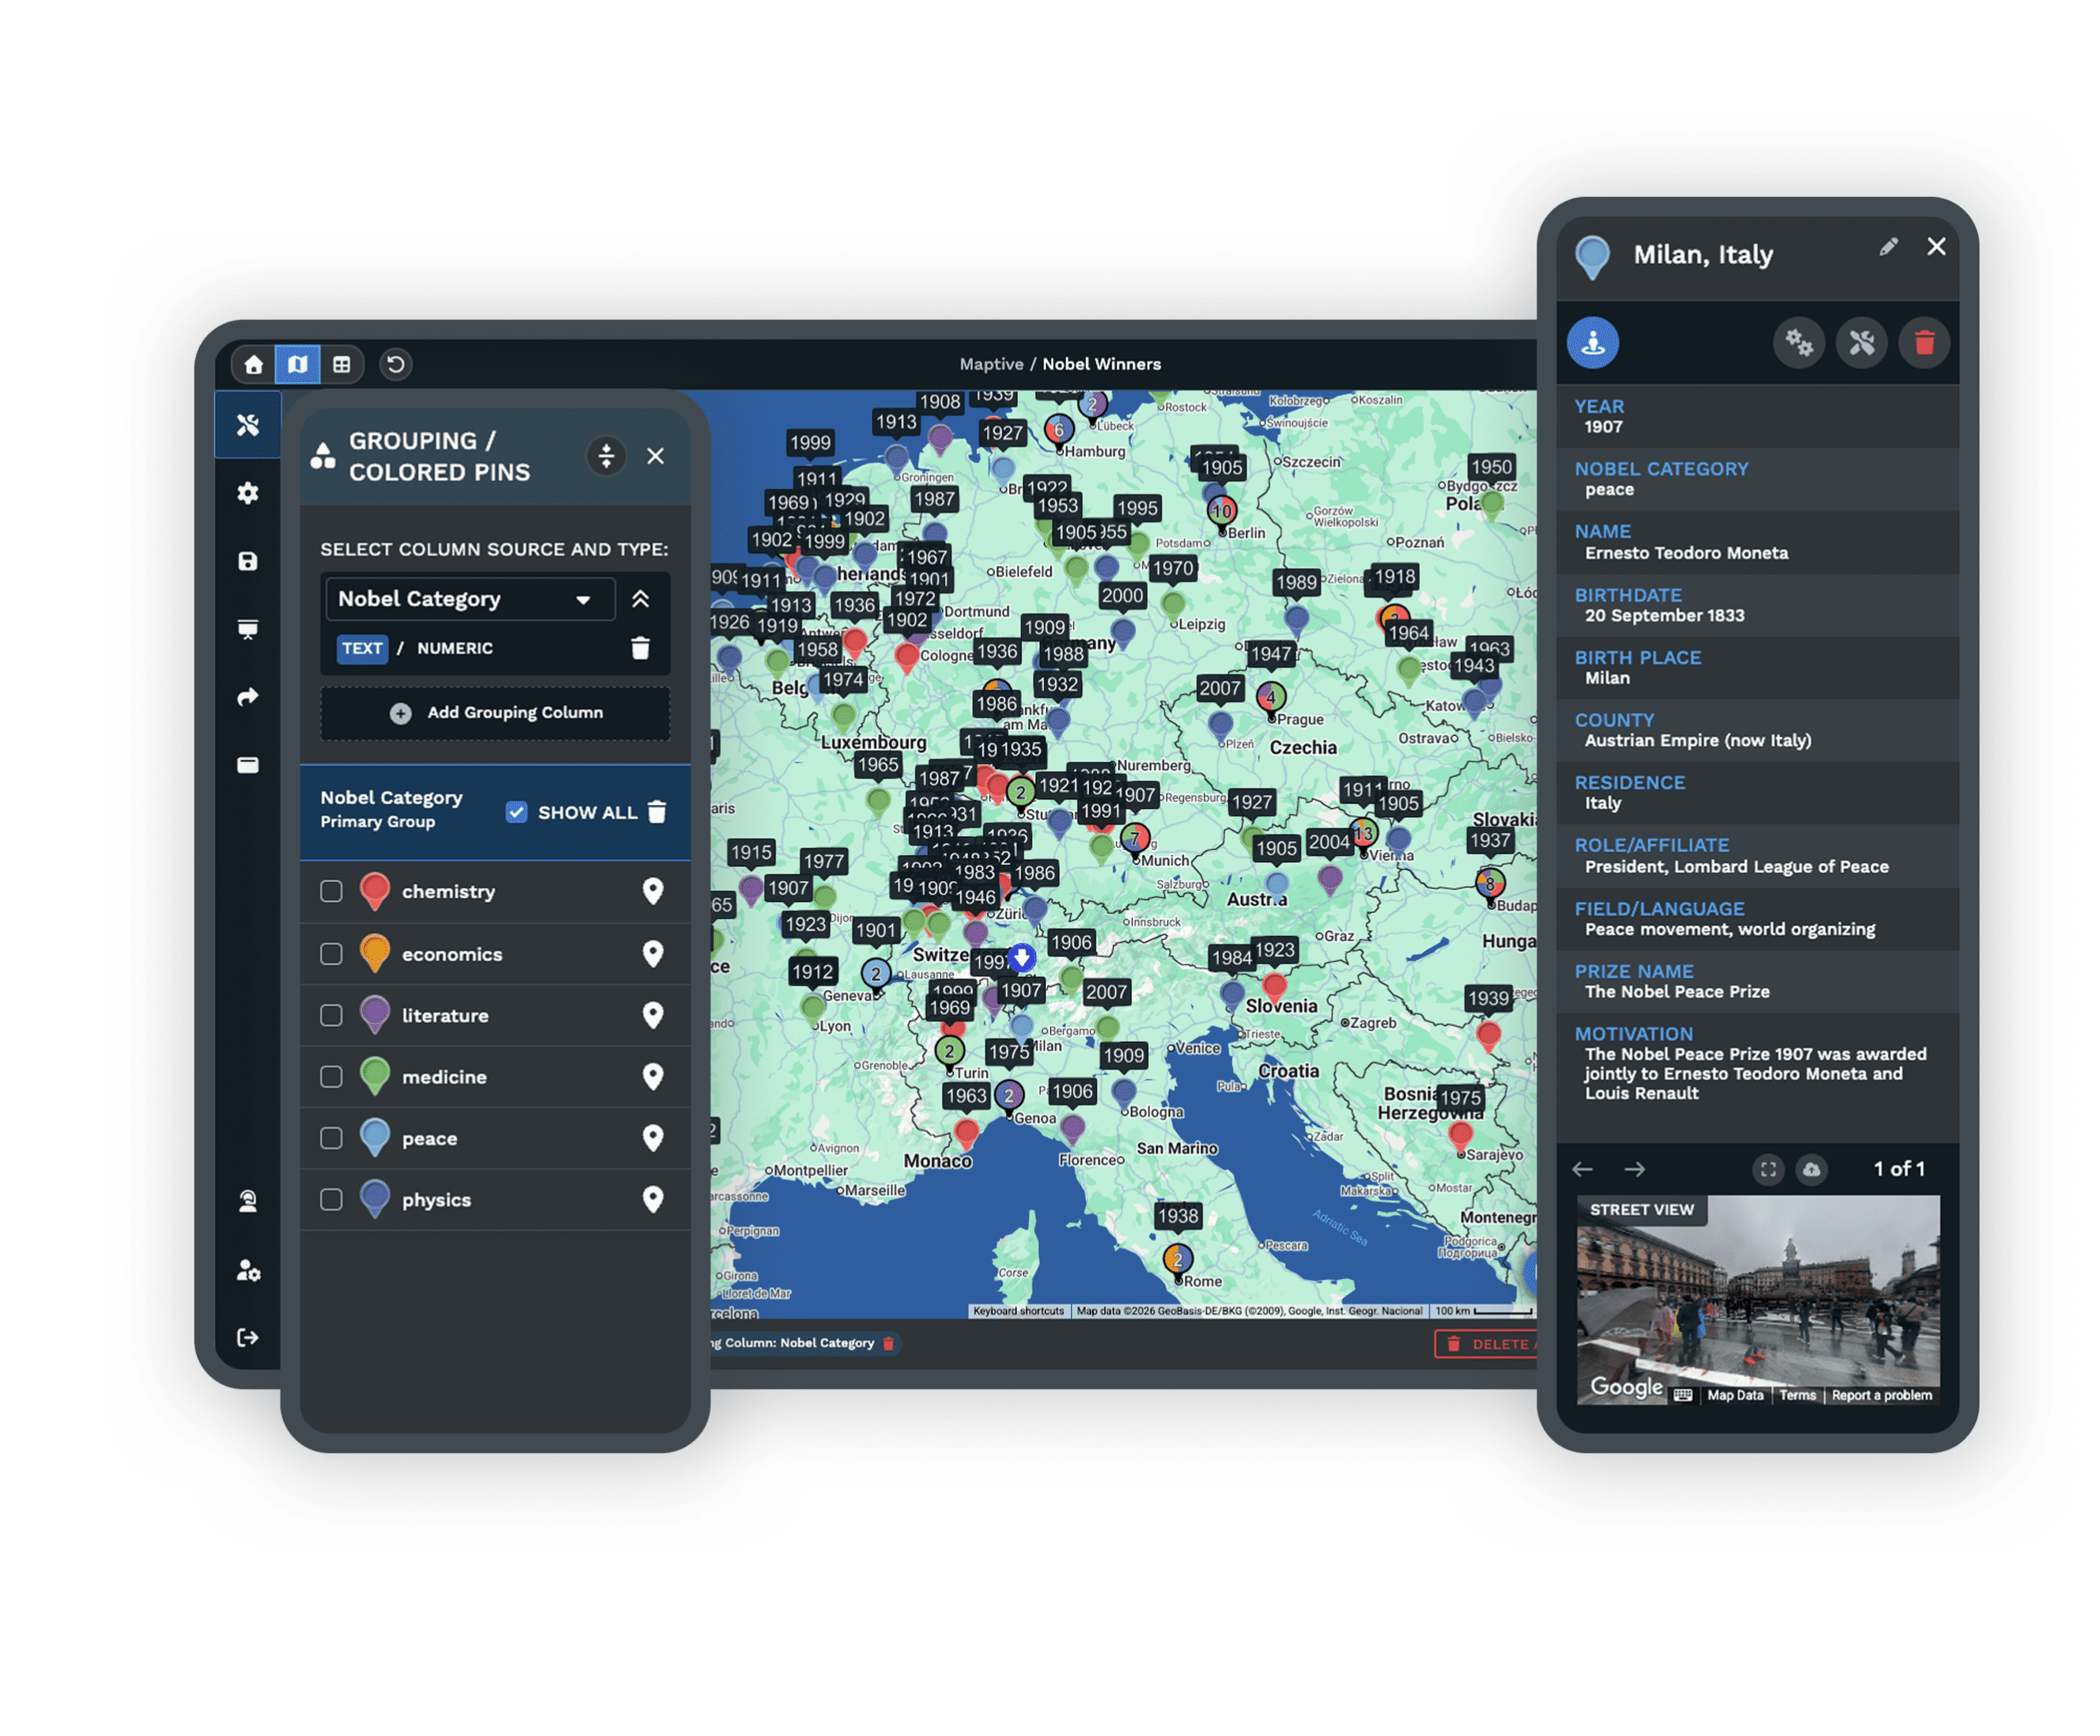
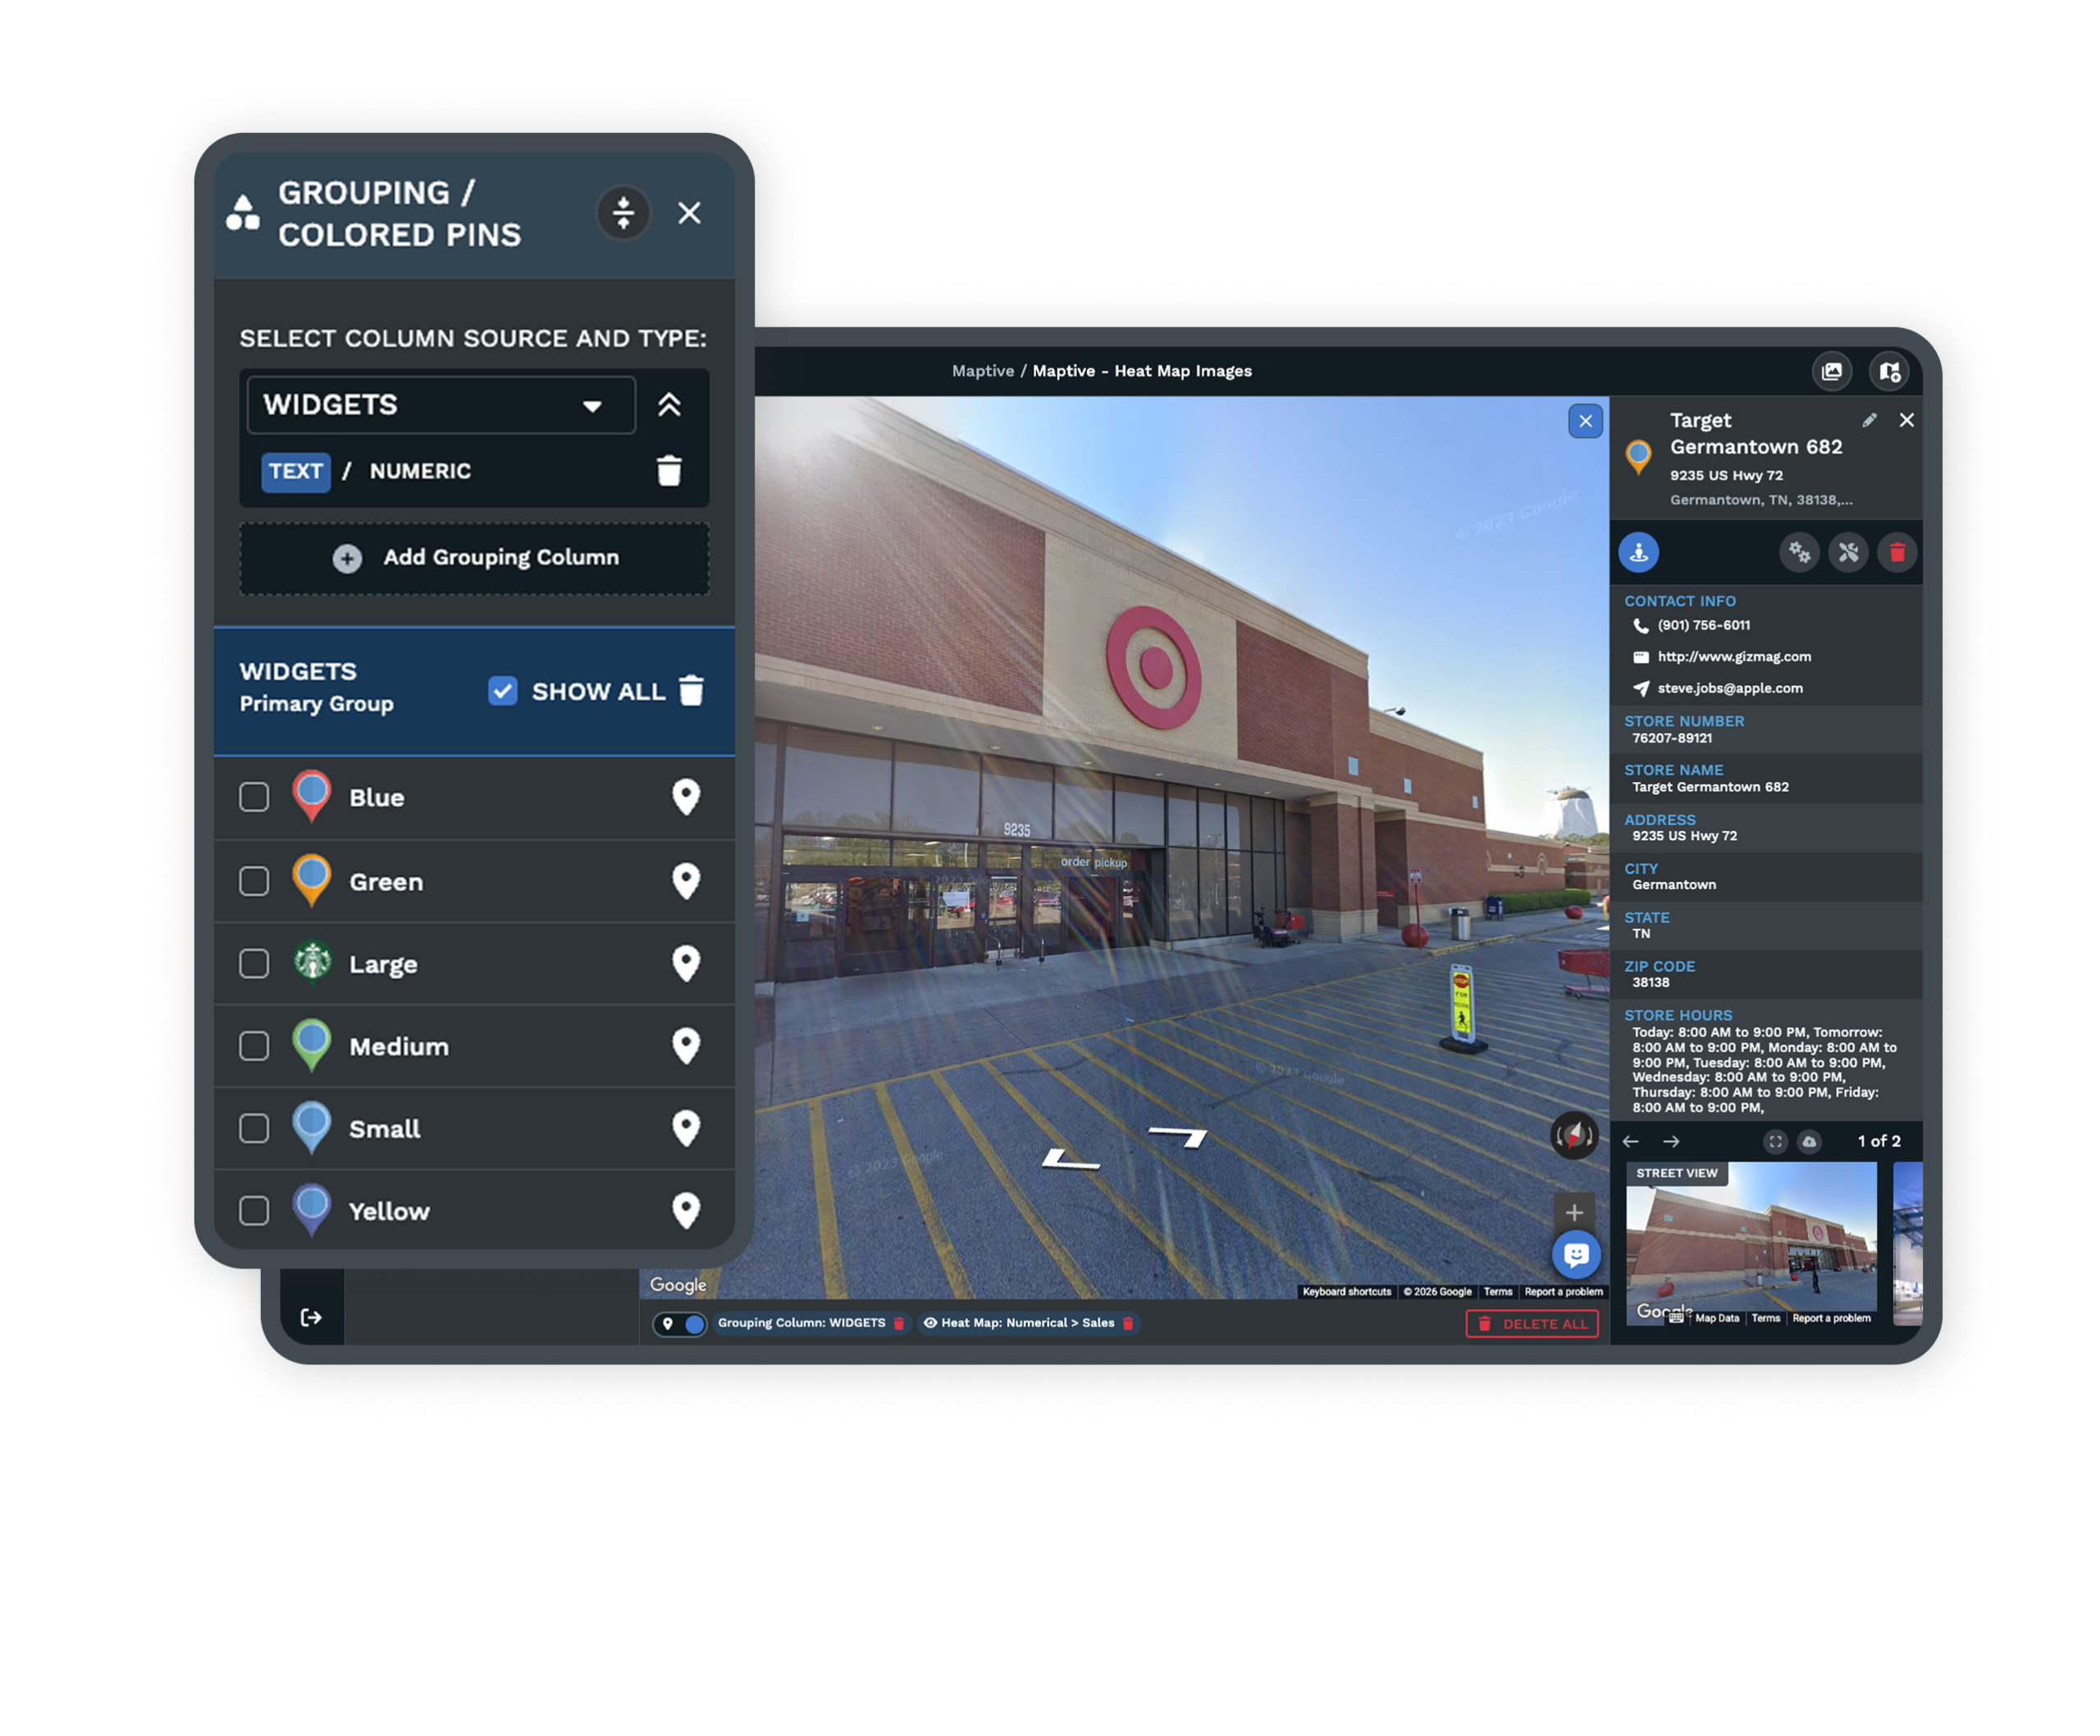
Colored Marker Grouping
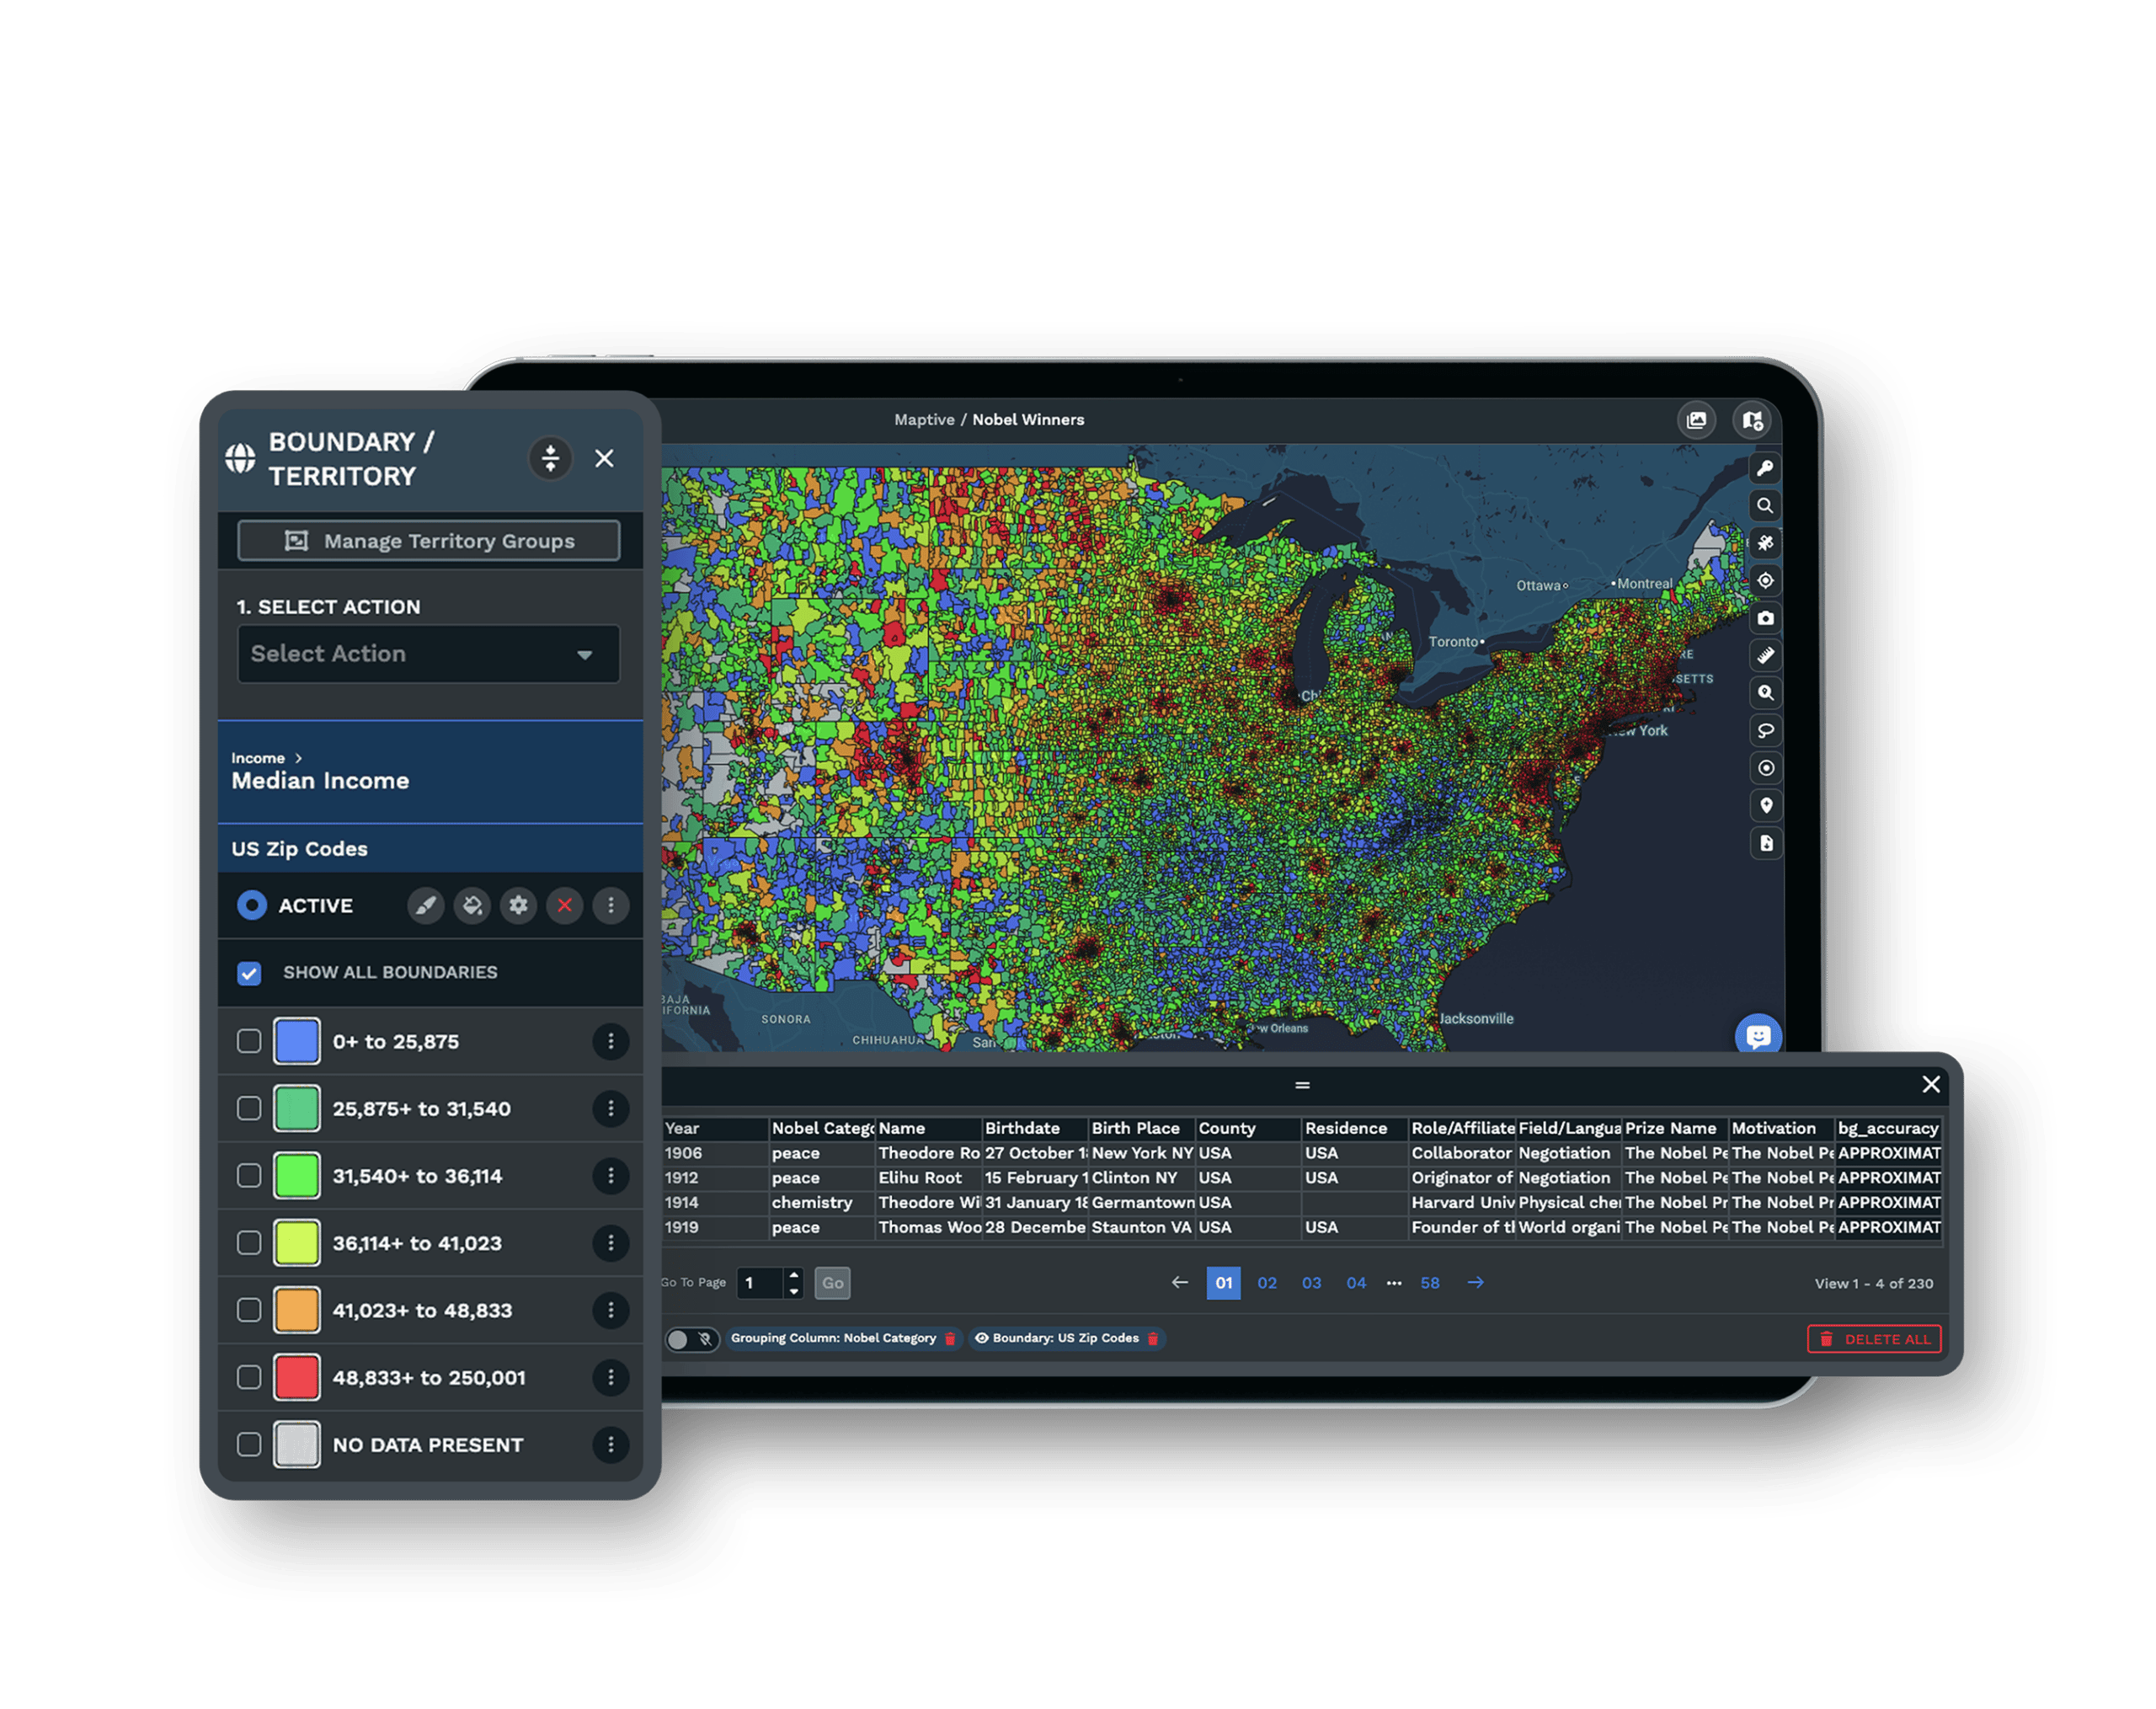
Bring clarity to data by grouping markers by category, instantly visualizing spreadsheet values with dynamic color coding.
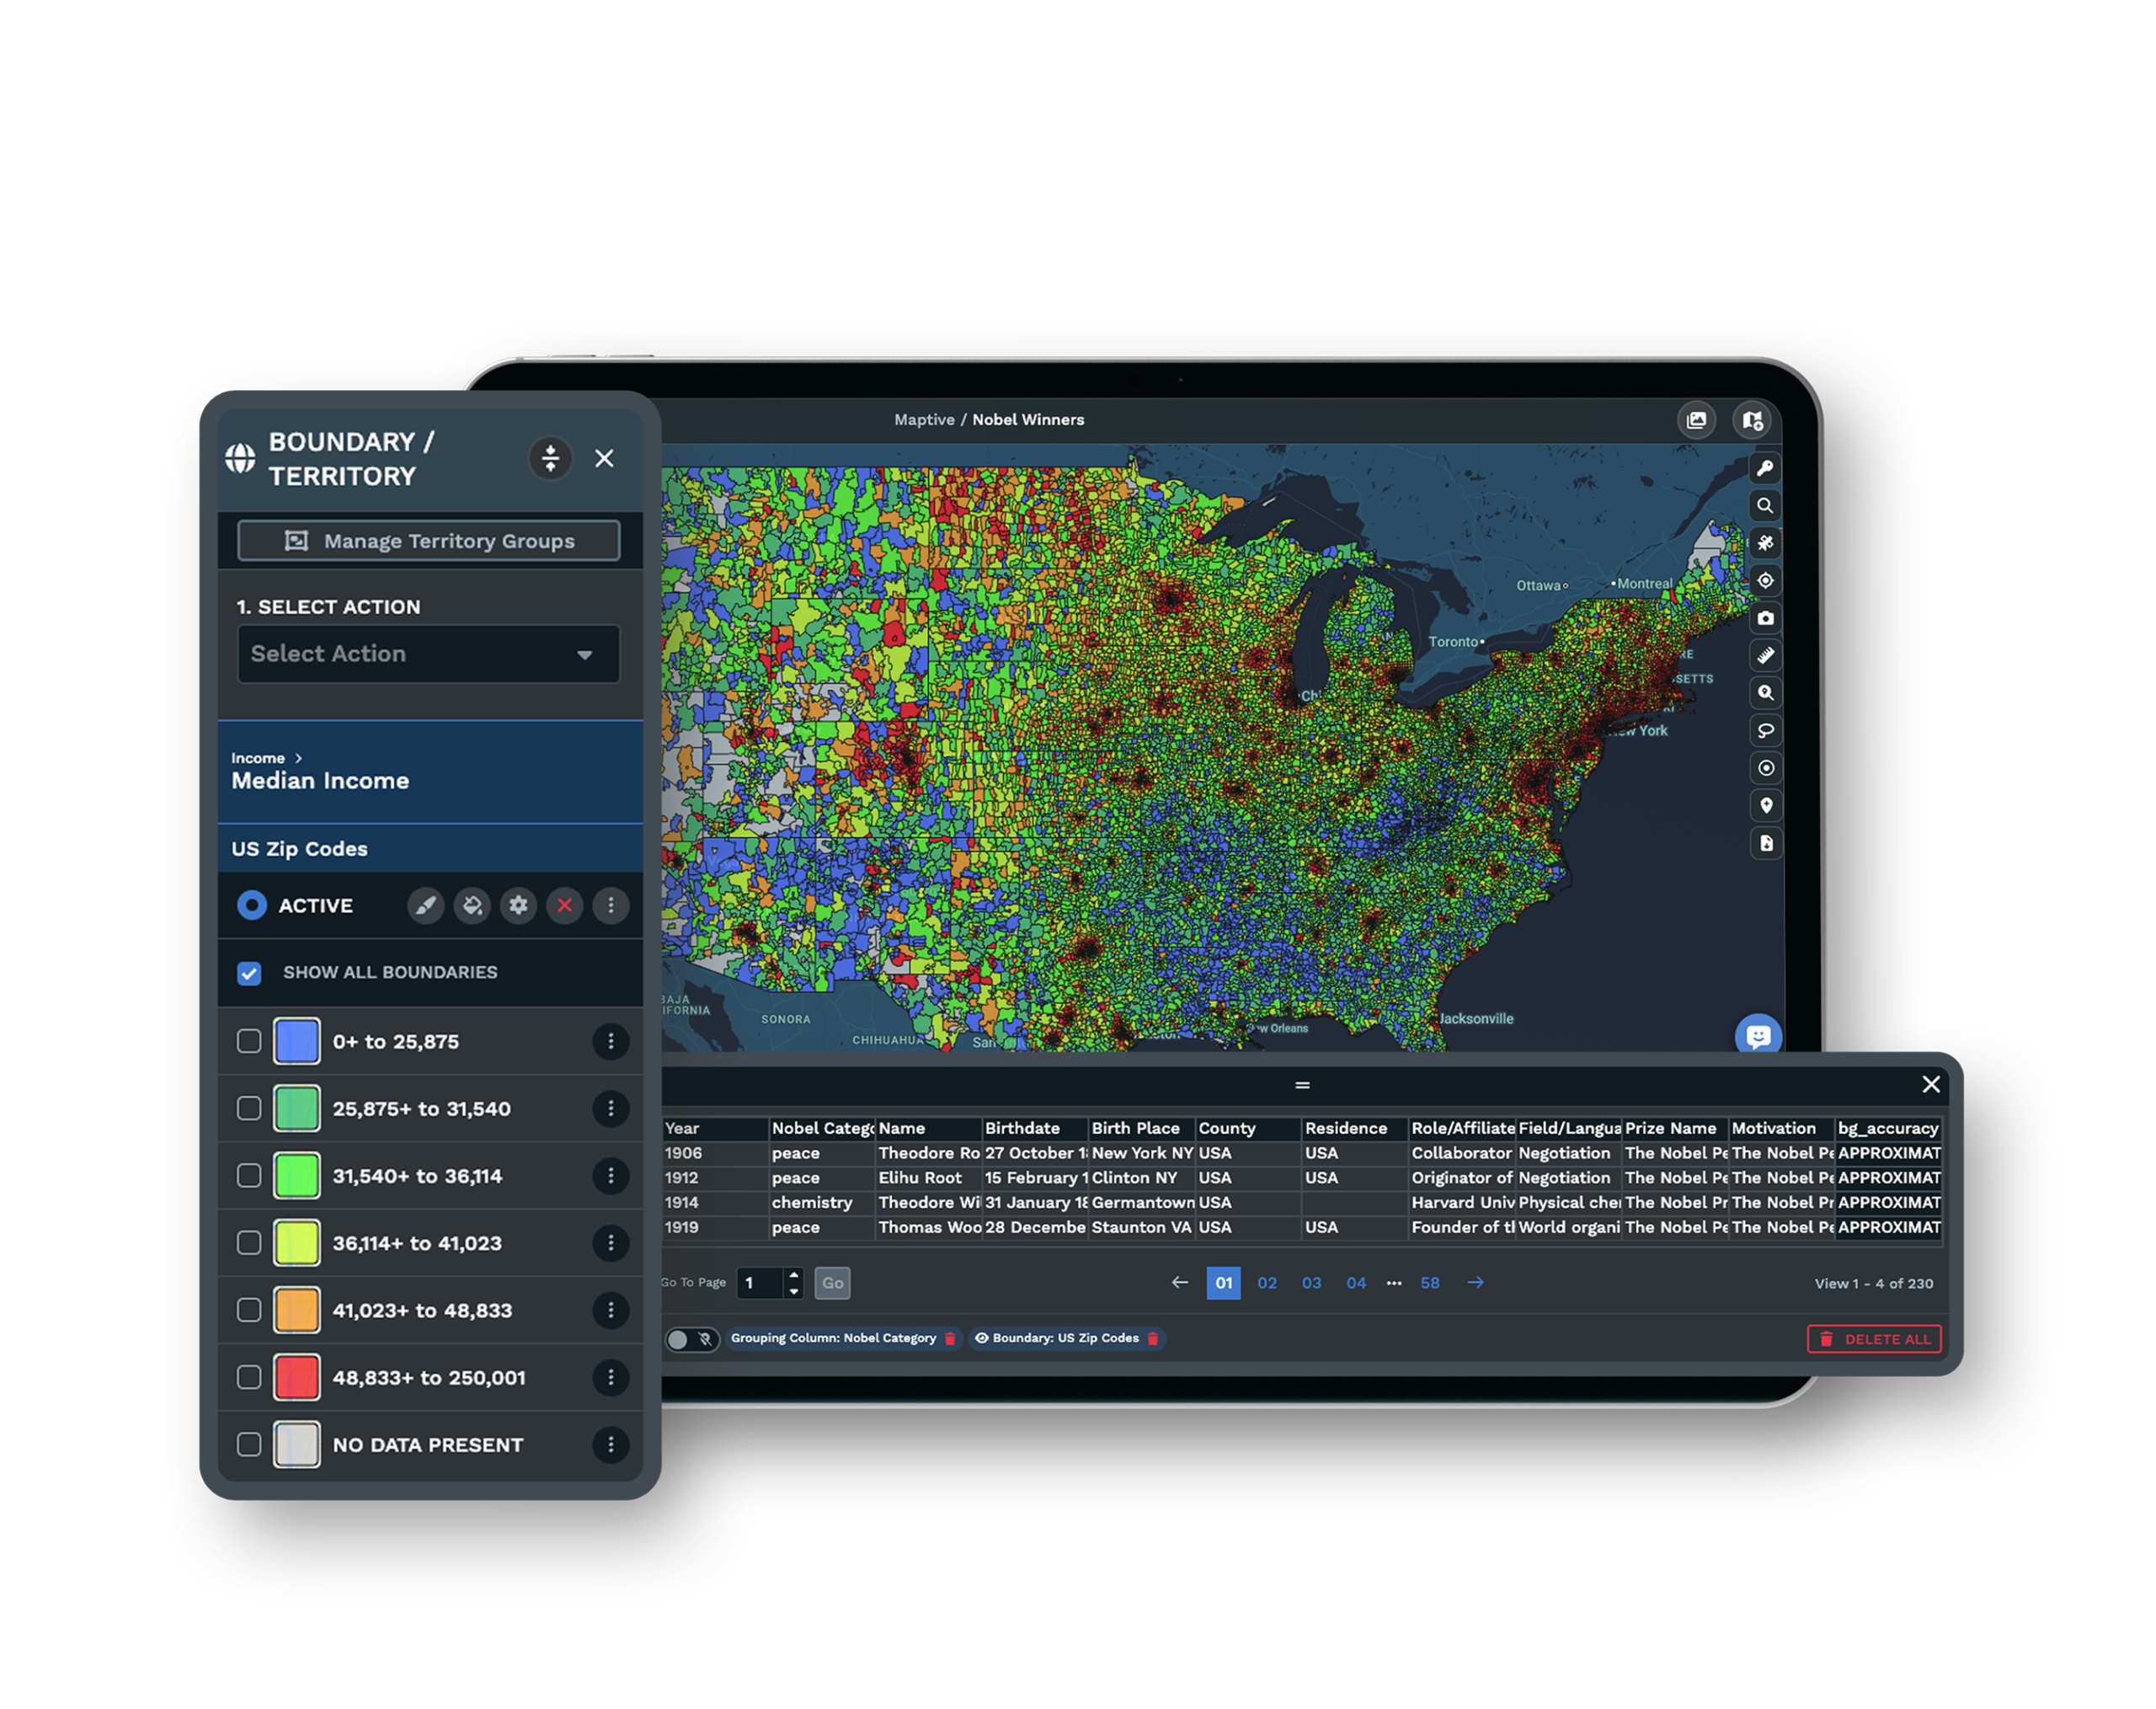
Demographic Maps
Integrate census data from the U.S. and Canada to evaluate population density, income levels, age groups, and more.
Heat Map Generator
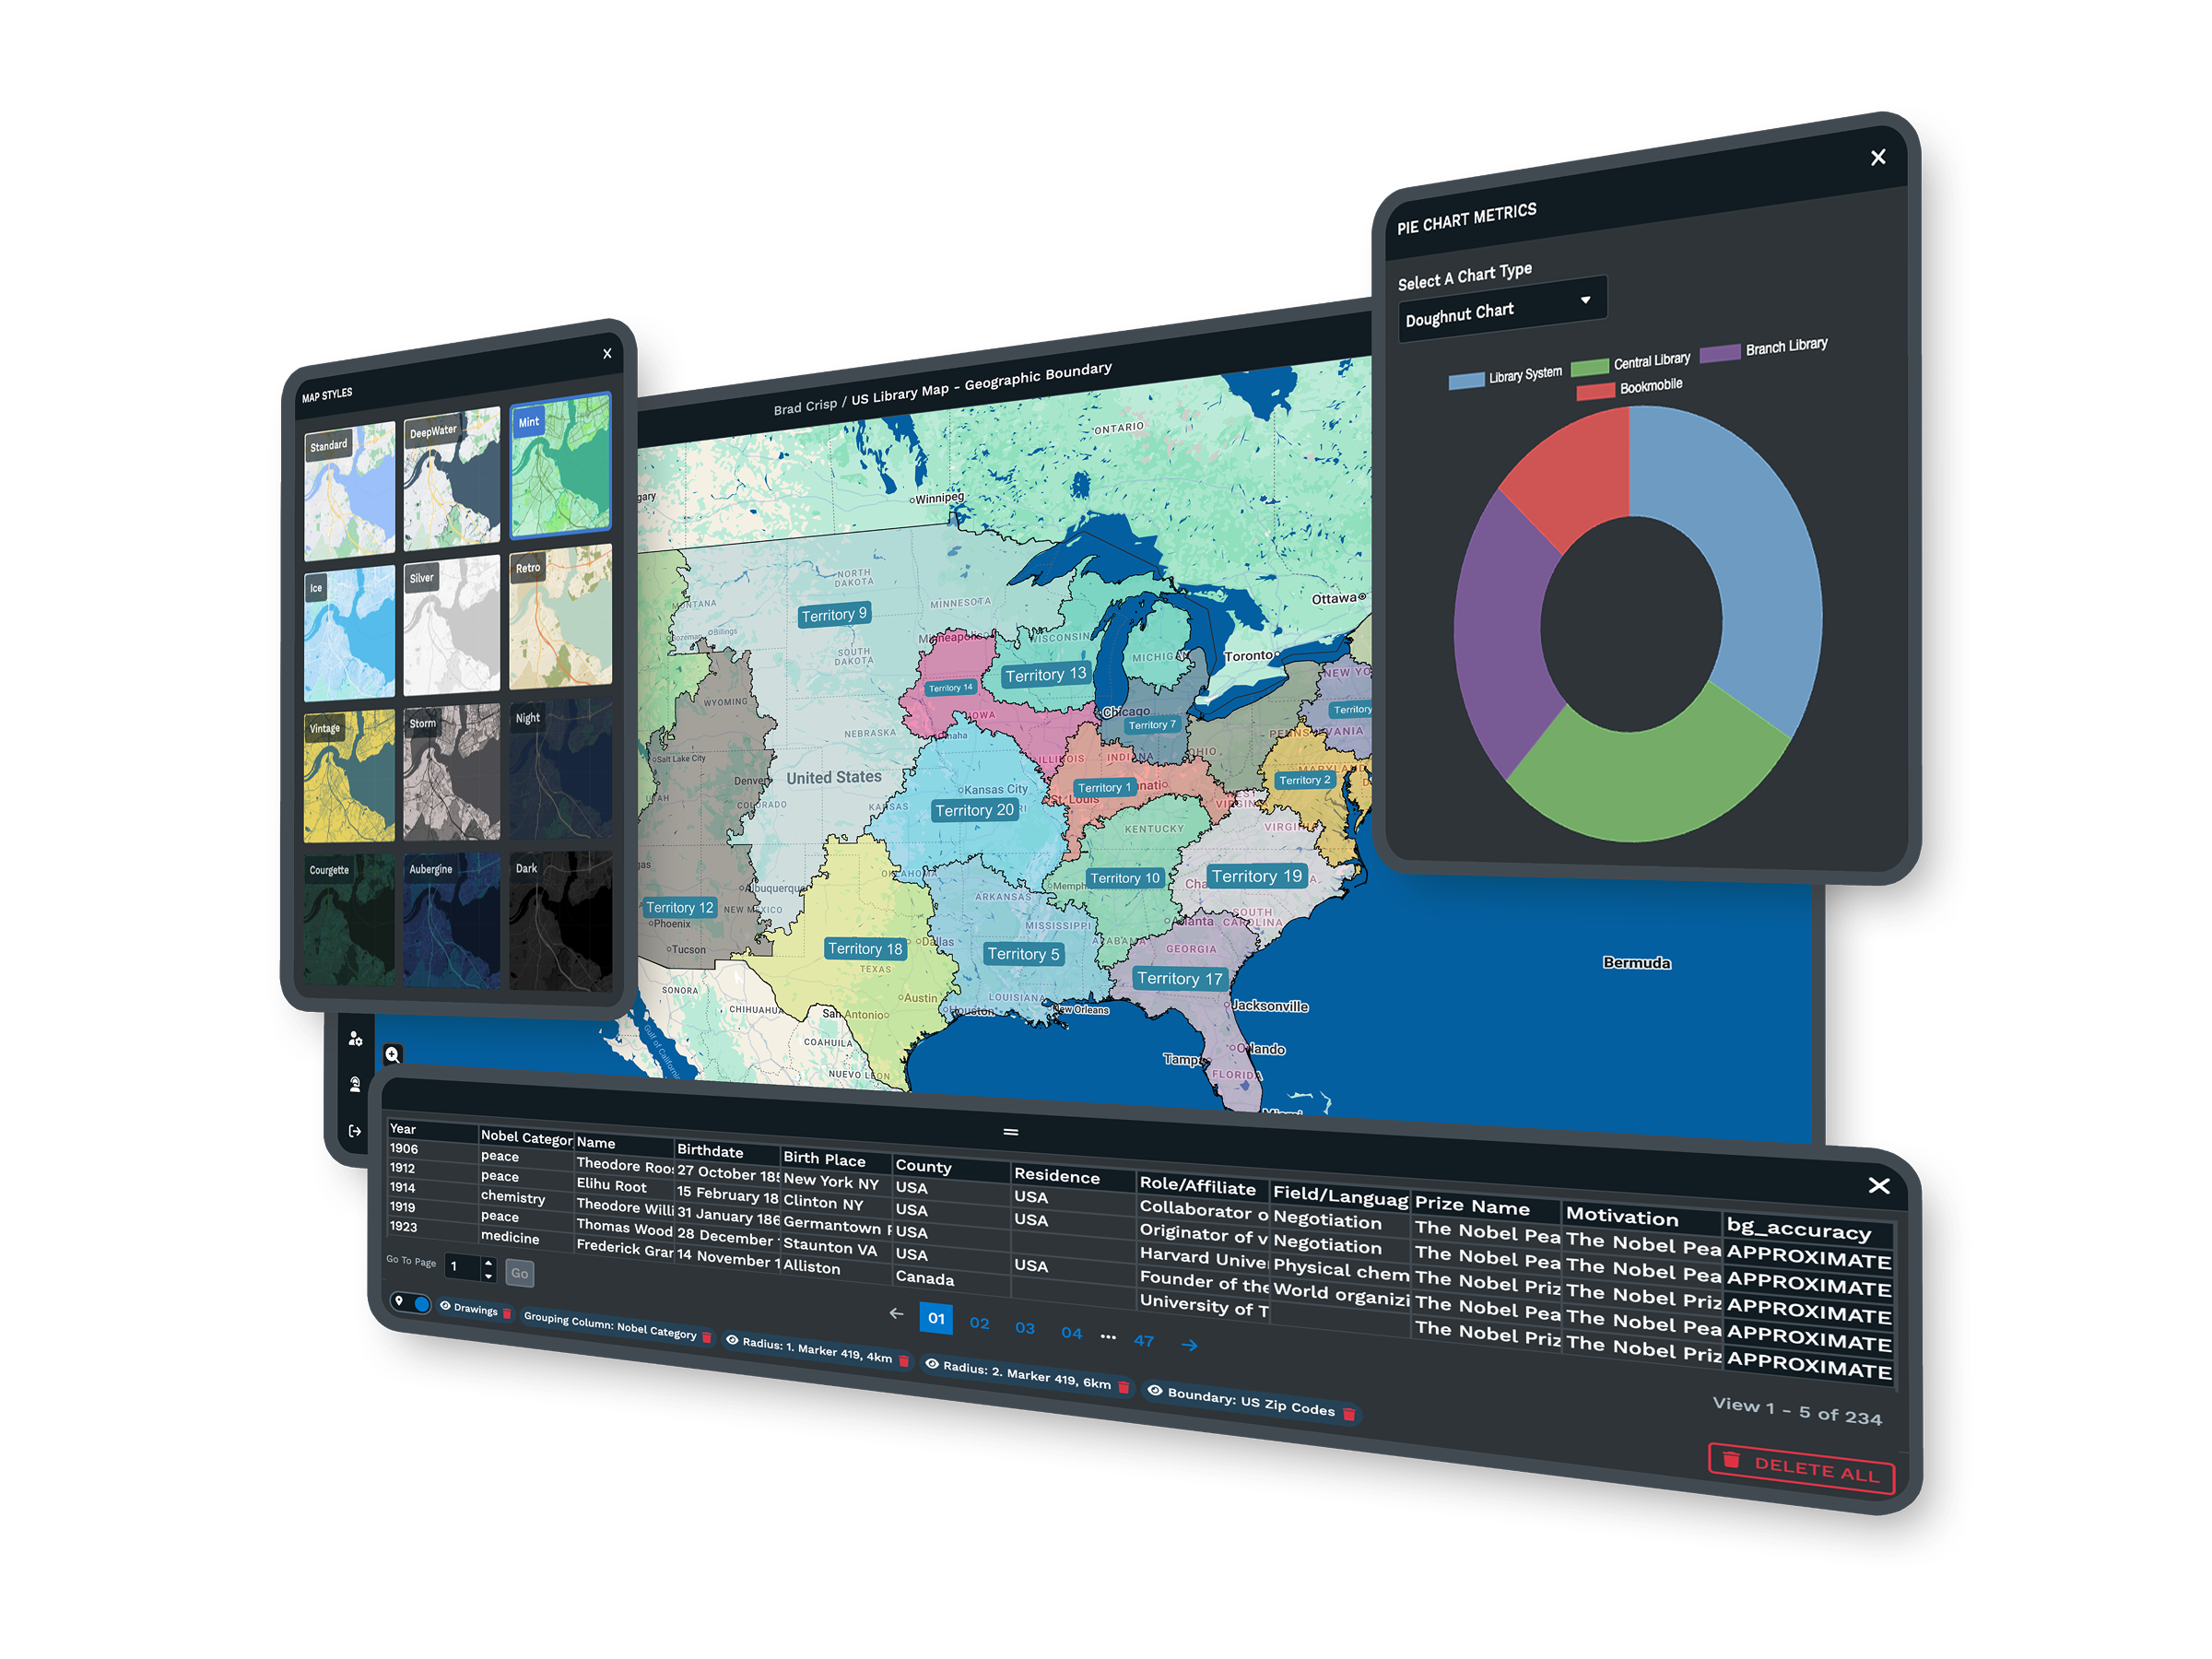
Visualize performance, density, or demographics with heat maps that transform raw numbers into clear, presentation-ready insights.
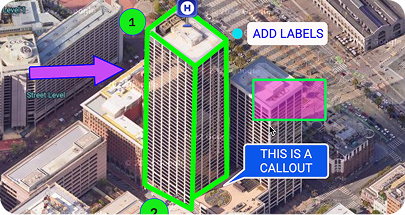
Drawing Tool
Highlight key areas with shapes, labels, text, or icons to make maps more informative for reports and client presentations.
Drive Time Polygons
Measure reach with polygons that display how far teams can travel within specific drive times, expressed in hours and minutes.
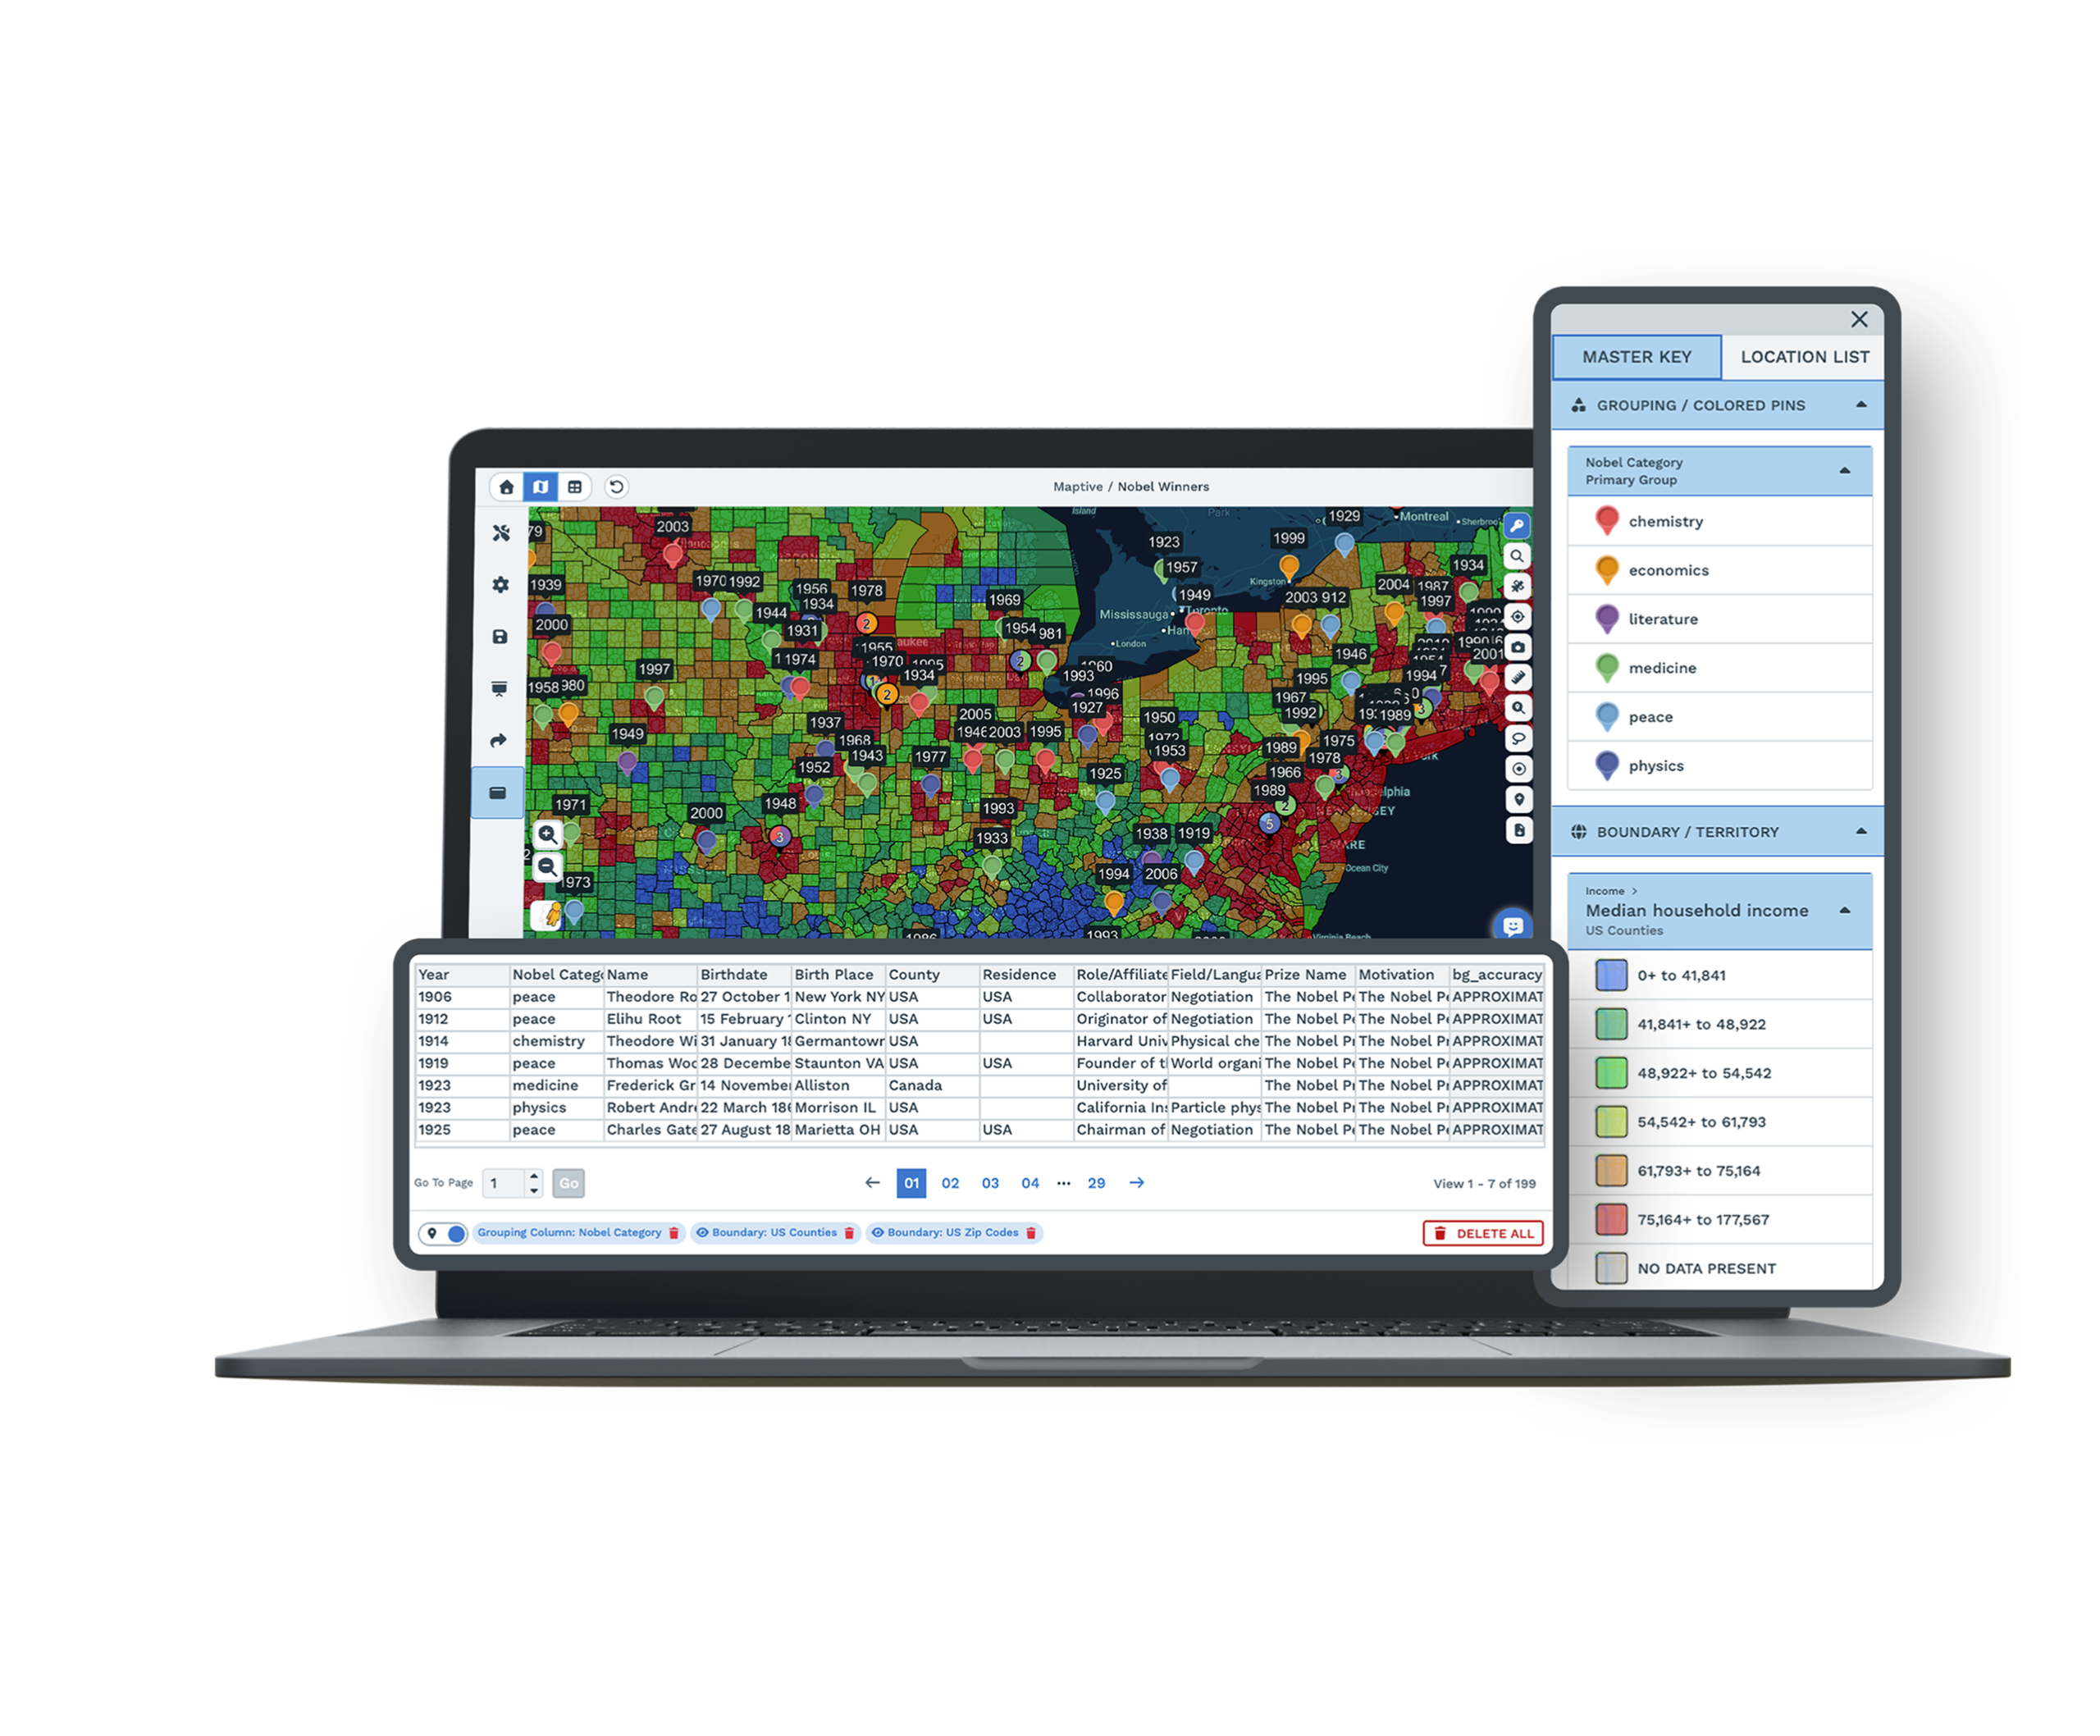
Spreadsheet to Map
From Spreadsheet to Map in One Upload
Your spreadsheet is the truth, but your leadership cannot read it in rows. Maptive plots the same data on an interactive map in minutes, with no cleanup beforehand.
Map spreadsheet data with one drag-and-drop. Drop an Excel or CSV file onto Maptive and the rows your boss does not read become a customized map that shows the story you want to tell.
"The Most Comprehensive Tool That's Also the Easiest to Use"
From Nicole at Indiana State University, after trying several other mapping tools. Maptive's overall G2 score is 9.7 across support, data visualization, and map creation, because it is a decision engine the business side can run without a GIS analyst.
Measured Results
What Teams Save With Maptive
Maptive ends the manual zip-by-zip work. Teams see payback in the first quarter.
Developer Ready
Full REST API, Included on Every Plan
Use Maptive's API to keep your map data automatically up to date. With access to the latest information at all times, you can make decisions with confidence.
See Your Data on a Map, Free
Start mapping with a free 10-day trial and no credit card required. Drop in a spreadsheet, paste data from your clipboard, or sync a live Google Sheet, and a working map is up before the meeting ends. The free mapping software unlocks all 60+ tools.
No credit card required · All 60+ tools unlocked
Frequently Asked Questions
What is Maptive?
Maptive is online mapping software you run in your browser. It is built for business teams that need to work with location data without hiring a GIS analyst. You upload your own information, see it on a Google base map, and use more than sixty tools to study it. People in sales, retail, logistics, real estate, and nonprofits use it to turn lists of addresses into something they can read clearly and act on.
How do I create a map from my data?
You start by bringing in your data. You can upload a spreadsheet, connect a Google Sheet, paste rows directly, or pull records from your CRM. Maptive places each location on the map for you, so there is nothing to install and no code to write. From there you can group your points by color, filter them, and add the tools you need. Most people have their first working map within about thirty minutes.
How much does Maptive cost, and is there a free trial?
You can try Maptive free for ten days, and you do not need to enter a credit card to start. After that, the 45 Day Pass is $250 for short projects, the Pro plan is $1,250 a year for one user, and the Team plan is $2,500 a year for five users. Larger organizations can ask about Enterprise pricing. There is no free version, though every paid plan opens all of the mapping tools.
Do I need GIS experience to use Maptive?
No, and that is the point of it. Maptive was made for people who have useful data but no training in geographic information systems. The tools work through a simple interface, and the map updates as you click, so you can see what each change does. If you ever get stuck, the support team will walk you through it. Many people build something useful on their first day without any help at all.
What types of maps can I build?
You can build a lot more than a set of pins. Maptive makes heat maps that show where your values are concentrated, territory maps drawn from ZIP codes or counties, radius and drive-time areas around any point, and demographic maps that bring in census data. You can size markers by a number, color them by category, and add your own shapes and labels. Each map is interactive, and you can save as many views as you need.
Can Maptive build and balance sales territories?
Yes. You can build territories from states, counties, ZIP codes, or census tracts, or draw your own boundaries by hand. The automated territory tool can balance them across more than one measure at the same time, such as workload and market potential, so no single rep ends up with far more than the others. When something changes, you can reassign areas between territories and watch the totals update, then export the result for your team.
What demographic data is included?
Every Maptive account comes with census data for the United States and Canada. You can look at population density, household income, age, and other measures at the state, county, ZIP code, and census tract levels. You add this data as a layer under your own points, which lets you compare where your customers are with the people who live in each area. It is included on every plan, with nothing extra to buy.
Can Maptive optimize routes for a field team?
Yes. You can give Maptive a list of stops and it will order them into an efficient route along real roads, up to seventy stops at a time. Your drivers get turn-by-turn directions they can open in Google Maps or Apple Maps, and the route updates if your stops change. Teams use this to cut fuel costs, fit more visits into a day, and give customers arrival times they can rely on.
Can I share, embed, or export my maps?
Yes, and you control how much each person sees. You can send a private link, publish a public one, or embed an interactive map on your website. For meetings, you can export a clean image as a PDF or PNG, or print a poster-size version. You can also export the underlying data, and you can hide sensitive columns so the people you share with only see what you want them to.
How does Maptive keep my data secure?
Maptive uses a secure connection and protects your account with measures like two-factor authentication and regular backups. You decide who can open each map, and you can keep maps private or limit them to people with a password. Sensitive fields can stay hidden from anyone you share with. For larger teams that need more control, the Enterprise plan adds further options, so you keep control of your location data while you use the platform.

