Looking at numbers in a spreadsheet isn’t a great way to discover insights or pick up on trends. That’s why more and more businesses are turning to data visualization (or data viz as it’s often referred to) to better understand the information they’re collecting.
When most people think about data visualization tools they think of graphs and charts. But new technology and platforms are allowing businesses to explore several different possibilities.
Table of Contents
As companies collect more and more information, it’s becoming difficult for the human brain to decipher sizeable complex data sets. Simply put: we need help.
This is where technology and machine learning can be a massive game-changer. AI can look at massive data sets and quickly identify patterns using powerful algorithms to provide instant data analysis. This saves valuable time and resources and prevents teams from deciphering data manually.
AI is already used to visualize data for health care services, sales, supply chains, customer analysis, and fraud prevention. You’ve likely used AI to visualize data yourself. Every time you ask Apple’s Siri or Amazon’s Alexa a question, you’re participating in the form of data visualization. You give the AI a query. In turn, the AI algorithm processes all the information available and then generates a visual response with the data you’re looking for in the form of links, images, graphs, etc.
The amount of new AI startups that have sprung up in the last few years is staggering. In 2023 there are AI solutions for every possible use case you can imagine.
AI is now more accessible than ever, with many open-source options, such as TensorFlow. Many major tech players have also jumped on the bandwagon and are offering AI and Machine Learning platforms, including Google’s AI Platform and Microsoft’s Azure Cloud Computing services. AI is shaping up to be the next significant evolution in technology.
This isn’t to say that AI will ultimately replace data scientists when visualizing and analyzing analytics. Even the best AI makes mistakes. But when you combine human intuition with sophisticated AI, you’ll find you end up with much better results.
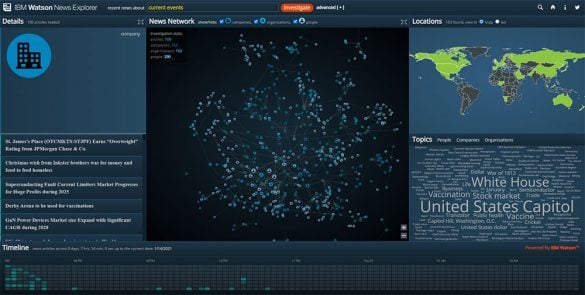
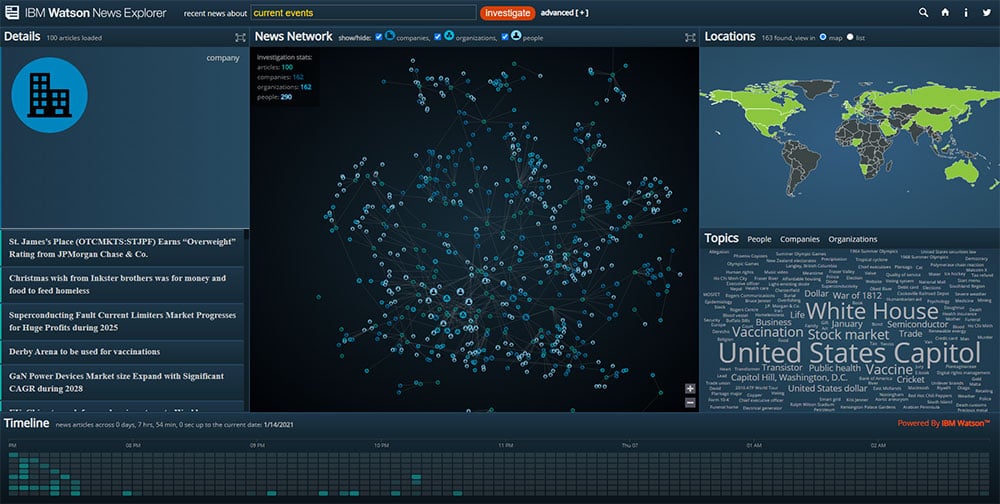
In 2017, Mauro Martino, a data visualization expert behind IBM’s Watson news explorer, created a dashboard that allows users to visualize the topics that were surfacing in the news. In 2021, Experts like Martino continue to push the boundaries of AI by doing research on methods to generate images from scratch using only collections of data. (Source)
Coming Soon to Maptive: Automated Territory Creation and Optimization (Mid 2024) – Take the guesswork out of splitting up territories. Maptive’s algorithms can use your business data to automatically and accurately build territory maps for your business.

The popularity of video as a means to convey information is rising. In fact, according to a recent survey, 66% of people would prefer to learn about a new product or service through a video. So, it’s no surprise businesses turn to video to visualize their data.
Currently, one of the most popular data visualization tactics is using video infographics. These are short videos (usually 90 seconds or less) that visualize and explain data for the audience.
Here are some advantages of video infographics:
If you’ve been using static images to display your data, consider livening things up with video content.
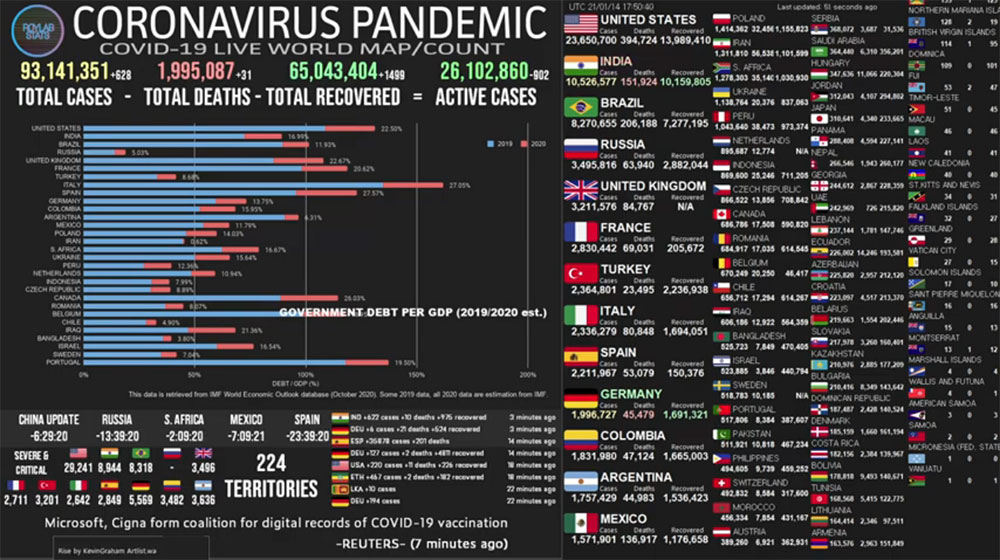
Roylab Stats, a YouTube channel with over 847,000 subscribers, uses up-to-date data from governments worldwide to track Covid related statistics in real-time.

If video is present, then virtual reality is the future. Many experts predict VR will change how we view data, and this trend is already beginning.
VR technology is used with data visualization software to create models, maps, games, and virtual events. These immersive projects allow you to view your data and interact with it. Virtual Reality makes it even easier for analysts to discover new patterns and insights within a dataset.
For example, when the United Kingdom was voting on whether to leave the European Union, Google created a VR visualization of the top questions asked around the world about the vote.
While the technology is still in its infancy, its capabilities are fascinating. The total VR market is projected to be worth $72.8 billion by 2024, so look for this form of data visualization to take off in the next few years.
In 2019, Google released Google Maps AR, the first augmented reality navigational mapping app. In 2021, Facebook, a company heavily invested in VR, plans to launch its first pair of augmented reality glasses. Facebook also released Spark AR studio, a powerful suite of tools for creating Augmented Reality experiences for sharing on social media. These big investments in AR from two of the biggest tech players show that AR is here to stay. In fact, you might not realize it, but whenever you use a visual effect on Facebook or Instagram that changes how you look, you are using a form of augmented reality.

Image Source: CNBC
Historically, companies would collect their data and only visualize and analyze it after some time. But this way of doing things is becoming obsolete.
Things change fast in the digital age, and businesses need to react quickly to what their data tells them—because of this, visualizing data in real time is more important than ever.
Businesses reacting quickly is even more critical during the COVID-19 pandemic. Governments and health authorities have used real-time data visualization to track infections and adapt accordingly. More and more companies are integrating real-time data into their product offerings.
Real-time Data visualizations can take the form of something as simple as a line chart updating in real-time or an interactive map that is updating with new information, such as sales, as fast as it comes in.
Maptive’s mapping software now offers real-time map data API integration to build interactive maps with your most up-to-date business data.
If you want to get the most out of your data analytics, you need to visualize them effectively. Don’t let your data go to waste. Whether you use traditional graphics like line charts, bar graphs, heat maps, and scatter plots or one of the techniques listed above, ensure you have a data visualization plan in place.
Fred Metterhausen is a Chicago based computer programmer, and product owner of the current version of Maptive. He has over 15 years of experience developing mapping applications as a freelance developer, including 12 with Maptive. He has seen how thousands of companies have used mapping to optimize various aspects of their workflow.
