Data is everywhere, but without the right tools, it’s just noise. Businesses today need powerful visualization software to transform raw numbers into meaningful insights. Whether you’re optimizing sales strategies, tracking customer trends, or making high-stakes business decisions, choosing the right data visualization tool can be a game-changer.
With new advancements in AI, automation, and cloud-based analytics, we’ve updated our list of the best data visualization tools in 2025 to help you find the perfect fit for your business.
Table of Contents
The global data visualization market is experiencing rapid growth, driven by the need to analyze vast amounts of data efficiently. According to recent projections, the market is expected to grow from $10.92 billion in 2025 to $18.36 billion by 2030. This impressive surge is fueled in part by advancements in artificial intelligence, machine learning, and automation–all technologies that are transforming how organizations extract and interpret insights from their data, including how they can visualize it.
Plus, thanks to AI-powered analytics, businesses no longer have to rely solely on data analysts—modern tools now incorporate machine learning algorithms that detect patterns, anomalies, and correlations instantly. This shift makes data more accessible to a broader range of professionals, enabling faster and more informed decision-making.
The increasing integration of AI in data visualization software means not just presenting information visually but also offering predictive and prescriptive analytics that drive business success.

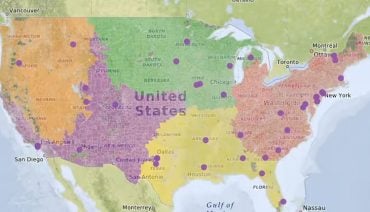
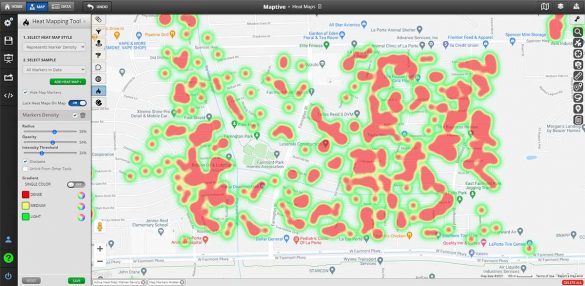
If your business relies on location-based data, Maptive is a must-have. This easy-to-use platform helps you create interactive heat maps, drive-time maps, and sales territory visualizations—all without any coding experience.
Perfect for real estate firms, logistics companies, and sales teams, Maptive transforms location-based insights into strategic business decisions.
Start Using Maptive With a Free 10-day Trial
As part of Google Cloud, Looker is designed for businesses that need real-time data visualization from multiple sources. It provides a seamless way to explore and analyze large datasets while integrating with cloud-based data warehouses. Whether you’re a startup or a large enterprise, Looker’s interactive dashboards make it easy to monitor KPIs, generate real-time reports, and uncover hidden insights with AI-driven analytics. Its powerful data modeling capabilities allow organizations to customize reports to fit their specific business needs, ensuring more accurate and actionable insights.
Looker is best for SaaS businesses, e-commerce brands, and enterprise analytics teams looking for a flexible, cloud-native BI tool.
![]()
If your business runs on Microsoft, Power BI is the ideal choice. It offers seamless integration with Excel, Azure, and Microsoft 365, giving teams the ability to analyze large datasets with ease. Power BI also provides robust interactive dashboard capabilities, AI-driven insights, and real-time data visualization, making it a comprehensive solution for businesses looking to streamline their analytics workflows.
Best suited for corporate teams, IT departments, and financial institutions, Power BI is a smart choice for businesses that need enterprise-grade data visualization.
![]()
Tableau remains an industry leader in 2025 thanks to its intuitive drag-and-drop functionality and AI-powered analytics. The platform’s ability to integrate with multiple data sources, from spreadsheets to cloud-based databases, makes it a versatile choice for organizations of all sizes. From finance teams analyzing quarterly trends to marketing departments tracking campaign performance, businesses rely on Tableau to transform raw data into compelling, interactive visuals that drive smarter decision-making.
Tableau is perfect for business analysts, data scientists, and professionals looking to explore data in-depth.
Not a data scientist? No problem. Canva makes it easy to create stunning infographics, charts, and marketing visuals with zero design experience. Unlike true data visualization or location intelligence software, Canva does not allow users to input raw datasets and generate analytical visuals directly—it requires users to manually design and format their charts and graphics.
Perfect for social media managers, content marketers, and small business owners who want engaging visuals without the complexity of traditional BI tools.
For businesses in retail and real estate, Geoblink offers location intelligence tools that help with market analysis, site selection, and competitive benchmarking by leveraging advanced data analytics and AI-driven insights. It enables businesses to visualize customer demographics, assess foot traffic patterns, and analyze local economic trends to make informed decisions. With real-time data updates and predictive modeling, Geoblink helps companies optimize their expansion strategies and stay ahead of market shifts.
Best for real estate investors, franchise owners, and urban planners looking to make data-driven decisions about physical locations.
Why It Stands Out:
With data driving every business decision, having the right visualization tool can mean the difference between guesswork and strategy. The tools on this list cater to a range of industries, whether you’re a small business owner, a corporate analyst, or a data scientist.
Ready to make better business decisions? Try a few of the tools on this list on a trial basis to see if they meet your needs. For example, Maptive offers a free trial to test the software without any risk.
Fred Metterhausen is a Chicago based computer programmer, and product owner of the current version of Maptive. He has over 15 years of experience developing mapping applications as a freelance developer, including 12 with Maptive. He has seen how thousands of companies have used mapping to optimize various aspects of their workflow.