
A tool built for a developer coding turn-by-turn navigation into a ride-sharing app has nothing in common with a tool built for a regional sales manager who needs to balance 40 territories across 3 states. Ranking those two products side by side on the same list forces a comparison that means nothing to either buyer.
Every other “best mapping software” article does this. They line up 10 or 15 platforms, assign each a score, and let you sort the list. The result is a ranking that tells a data scientist nothing about their options and tells a logistics coordinator nothing about theirs. A developer API and a business mapping tool are not competing products. They serve different people solving different problems, and evaluating them on the same criteria produces misleading results.
This guide takes a different approach. It organizes 15 platforms into 5 categories defined by the problem each one solves, so you can identify the category that matches your work, read that section, and skip the rest.
The 5 Categories This Guide Covers and Who Each Serves
The mapping software market splits along 5 functional lines, and each one serves a distinct buyer with distinct requirements.
- Business operations, territory management, and field sales. This category fits teams that assign people to geographic areas, plan routes between stops, and layer business data onto a map. Sales organizations, field service operations, and franchise networks live here.
- Quick spreadsheet-to-map visualization. This is for anyone who has a column of addresses in a spreadsheet and wants them plotted on a map with minimal setup. No analysis, no territory logic, no routing. Speed and simplicity are the entire value proposition.
- Developer APIs and SDKs. This category serves engineering teams building map functionality into their own applications. These are not tools you log into. They are infrastructure you write code against.
- Enterprise GIS and full-scale spatial analysis. Government agencies, utility companies, environmental scientists, and engineering firms that need raster processing, coordinate system management, and Python-scripted geospatial workflows belong here. These tools require trained GIS professionals to operate effectively.
- Location intelligence and spatial data science. Data science teams running spatial queries against cloud data warehouses with millions of records occupy this category. The tools connect to BigQuery, Snowflake, or Databricks and analyze geographic data where it already lives.
Find your category. Go directly to that section.
What Online Mapping Software Is and What It Is Not
What Qualifies as Online Mapping Software in 2026
Online mapping software is any cloud-accessible platform that lets you create, customize, analyze, or embed geographic visualizations using your own data or third-party datasets. The defining characteristic is browser-based access with no local installation required. You open a browser, log in, and your maps and data are available from any device with an internet connection.
This definition excludes consumer navigation apps like Google Maps, Apple Maps, and Waze. Those display maps, but they do not let you import a dataset, build territories, or run spatial analysis against your own records. It also excludes desktop-only GIS installations that require software on a local machine. The “online” qualifier matters because it means any team member with a browser can access the same maps and data without IT involvement, local software configuration, or license keys tied to individual machines.
The market is large. 6sense estimates that more than 124,500 companies use mapping and GIS software globally as of 2026, spread across fundamentally different use cases that require fundamentally different tools. A company using Mapbox to build a delivery tracking app and a company using QGIS to model erosion patterns share nothing in common except that both products appear in the same market research category. Understanding which segment of this market applies to your needs is the first step toward choosing well.
What Is the Difference Between GIS Software and Business Mapping Tools?
This is the single biggest source of mismatched purchases in the mapping software market, and it costs teams months of wasted effort and thousands of dollars spent on the wrong product.
GIS, or Geographic Information Systems, refers to software designed for spatial analysis at a scientific or engineering level. GIS platforms handle raster and vector data processing, coordinate system management, terrain modeling, watershed analysis, network analysis, and scripted spatial workflows. They assume the user understands geospatial concepts, projection systems, and data formats like Shapefiles, GeoJSON, and GeoTIFF. The learning curve is measured in weeks or months.
Business mapping tools operate on a different set of assumptions entirely. They assume you have a spreadsheet full of addresses and a business question you need answered. Can I see where my customers are concentrated? How should I divide this region among 6 sales reps? What is the fastest route between these 35 stops? These platforms handle location plotting, territory management, route planning, and demographic overlays without requiring any GIS training. The learning curve is measured in minutes.
The distinction matters operationally. Choosing ArcGIS for sales territory management is equivalent to hiring an architect to hang a picture frame. The architect is technically capable of the task, but the tool is massively over-specified, the cost is orders of magnitude higher than necessary, and the person using it needs training they should not have to acquire. Esri, the company behind ArcGIS, holds 26.70% of the GIS market according to GREY Journal’s research and serves 95% of the largest national governments. That is the audience ArcGIS is built for.
Conversely, a business mapping tool cannot perform watershed analysis, terrain modeling, or raster processing. If your organization employs GIS professionals who work with LIDAR data or coordinate reference systems, a business mapping platform will not meet your needs.
Before you evaluate a single platform, determine which side of this line you fall on. The answer eliminates half the market immediately. A simple test: if your team’s primary tool for working with geographic data is currently a spreadsheet (Excel, Google Sheets, or a CRM export), you are on the business mapping side. If your team currently uses Python libraries like GeoPandas or works with coordinate reference systems and projection transformations, you are on the GIS side.
Can You Use Google Maps for Business Mapping?
No. Google Maps, the consumer product you use on your phone, does not support data import from spreadsheets, territory creation, heat mapping, demographic overlays, or CRM integration. It is a navigation and discovery tool for consumers.
Google Maps Platform, the developer API, provides building blocks for map functionality (geocoding, routing, tile rendering), but those building blocks require a development team to assemble them into a working application. There is no user interface for a business professional to log in, upload data, and start analyzing.
If your team needs to upload a spreadsheet of customer addresses, see them on a map, filter by region, and plan driving routes between them, neither Google Maps product will do that. You need a dedicated business mapping platform. Several business mapping platforms in this guide are built on top of Google Maps infrastructure, which gives you the familiar Google Maps visual layer combined with the business-specific tools (territory management, data import, demographic overlays) that Google itself does not provide.
6 Evaluation Criteria for Choosing Online Mapping Software
Before reading individual platform reviews, establish the criteria you will use to evaluate them. These 6 factors apply across all 5 categories, and each one reveals something that a product’s marketing page will not tell you.
Data Capacity and Performance Thresholds
The variable most buyers overlook is how many data points a platform can handle before performance falls apart. A tool that runs smoothly with 500 addresses may freeze, lag, or crash entirely at 50,000. The only reliable test is loading your actual dataset during a trial period, not a sample.
General capacity ranges vary by category. Business mapping tools typically handle between 50,000 and 250,000 markers before performance degrades. Enterprise GIS tools scale into millions of features but require infrastructure and expertise to operate at that level. Quick-visualization tools often cap between 1,000 and 15,000 locations. If your dataset exceeds a tool’s practical limit, every other feature becomes irrelevant.
Pay attention to two performance indicators during testing. First, how long does the initial data load take? A platform that requires 10 minutes to geocode and render 20,000 addresses will frustrate users who need to refresh data weekly. Second, does the map remain responsive after the data loads? Some platforms render pins quickly but slow to a crawl when you try to filter, group, or interact with the map at high data volumes.
Pricing Models and Total Cost of Ownership
Four pricing models exist across the market. Per-user annual subscriptions are the most common for business mapping tools. Usage-based pricing, charged per API call or map load, is standard for developer platforms. One-time license purchases with ongoing data subscriptions apply to some desktop GIS products. Free and freemium models gate features or capacity behind upgrade thresholds.
Sticker price is the least useful number in this comparison. The costs that actually determine your total spend are the time required to learn the platform (weeks for GIS versus minutes for quick-visualization tools), the cost of data subscriptions (demographic data, boundary files, and business listings are sometimes bundled and sometimes sold separately), and the cost of additional seats as the team expands. Enterprise GIS runs thousands to tens of thousands annually. Business mapping tools fall between $250 and $2,500 per year. Quick-visualization tools range from free to $99 per month. Developer APIs charge per usage with free tiers that cover low-volume projects.
Calculate your 12-month total including all seats, all data, and all ramp-up time before comparing platforms on price. A platform that costs $2,500 per year with demographic data included, zero training investment, and support that answers questions may cost less over 12 months than a platform at $695 per year that requires a separate $1,200 data subscription, 40 hours of training, and troubleshooting without dedicated support.
Learning Curve and Time to First Useful Output
“Ease of use” is a meaningless phrase in a product review. “Time to first useful output” is measurable. Some platforms let you upload a spreadsheet and produce a working, filterable map in 30 minutes. Others require weeks of training, documentation study, and possibly a dedicated hire before the first useful output appears.
The question to ask is specific to your team. Who on your staff will use this tool, and how much training time can you absorb? If the answer is “our sales manager, who has no GIS background, and we cannot spare more than an afternoon,” then enterprise GIS is disqualified regardless of how powerful it is. User reviews on G2 and Capterra consistently show that ArcGIS requires weeks to become proficient, while business mapping tools report productive use within the first hour. Developer APIs fall somewhere in between, depending on the skill level of the engineering team. Match the platform’s learning curve to your team’s realistic availability for training.
CRM and Data Source Integration
Mapping software that does not connect to your team’s existing data sources creates a manual export-import loop that kills adoption within weeks. If every map update requires exporting from Salesforce, reformatting in Excel, and re-uploading to the mapping tool, your team will stop using it. The people who most need geographic insight from their data are the same people least likely to tolerate a 15-step import process twice a week.
Check if integration with your CRM (Salesforce, HubSpot, Zoho) and data sources (Google Sheets, Excel, CSV) is built in, requires an API connection your developers must build, or does not exist at all. Also look at sync frequency. Some integrations are live, updating the map within minutes of a CRM change. Others require manual re-import. For sales teams managing active pipelines, the difference between live sync and weekly batch imports affects how useful the map is for daily decisions. Most quick-visualization tools and open-source GIS tools lack CRM integration entirely, which limits them to teams that do not depend on CRM data for their mapping workflows.
Scalability and What Happens When You Outgrow a Tool
A question no competing article in this market covers: what happens when your needs exceed what the tool can do? A platform that works well for a 5-person sales team covering 10 territories may not support 50 territories, 200,000 data points, or integration with an enterprise CRM.
Evaluate where your team will be in 12 to 18 months, not where it is today. Switching mapping platforms mid-operation is disruptive in ways that are easy to underestimate. Territories need to be rebuilt. Data needs to be re-imported and re-geocoded. Workflows need to be retrained. Users who learned one interface must learn another. If your growth trajectory is predictable, buy for where you are headed. Ask during the trial: does this platform have a tier that accommodates my team at 2 to 3 times its current size, and what does that tier cost?
Customer Support Quality and Availability
Open-source tools rely on community forums and documentation. Developer APIs rely on documentation and Stack Overflow. SaaS business tools vary from email-only support to dedicated account managers with live training sessions.
For teams without GIS training or dedicated technical staff, responsive support that includes live onboarding and data setup assistance is not optional. It determines if the tool gets adopted or abandoned after the first month. Check if support is available on all pricing tiers or gated behind premium plans. A platform that charges $1,250 per year with support on all tiers may deliver better long-term value than a platform at $500 per year where support requires an upgrade to a $2,000 enterprise tier.
The evaluation criteria above give you a scoring system. The platform categories below give you the shortlist to score against. Starting with the largest and most commercially relevant category.
Online Mapping Software for Business Operations, Territory Management, and Field Sales
Who Belongs in This Category and What to Expect
If your work involves assigning people to geographic areas, this is your category. Sales directors dividing regions among reps, logistics coordinators planning daily routes, franchise operators defining exclusive zones, and field service managers dispatching technicians all share the same core requirement. They need tools that go well beyond plotting pins on a map.
Platforms in this category handle territory creation and balancing, route optimization between multiple stops, demographic and census data overlays, CRM data synchronization, and analytical tools that turn geographic data into operational decisions. They assume no GIS training. They assume you have a spreadsheet and a business problem. Pricing ranges from $250 to $2,500 per year.
The 4 platforms below share this category but differ in scope, depth, pricing, and integration. Some offer a broad toolkit covering dozens of analytical functions. Others specialize in a single workflow like Salesforce territory management or budget-friendly pin mapping. The differences between them are more relevant to your decision than the differences between this category and any other.
Maptive: the Broadest Feature Set for Business Mapping Without GIS Complexity
Maptive is a browser-based mapping platform built on enterprise infrastructure that bundles 60+ mapping and analysis tools into every pricing tier with no feature gating. That last point is worth emphasizing because it is unusual in this market. A solo user on the $1,250/year Pro plan has access to the same analytical tools as a 10-person team on the Enterprise tier. The tiers differ by user count, data capacity, and support level.
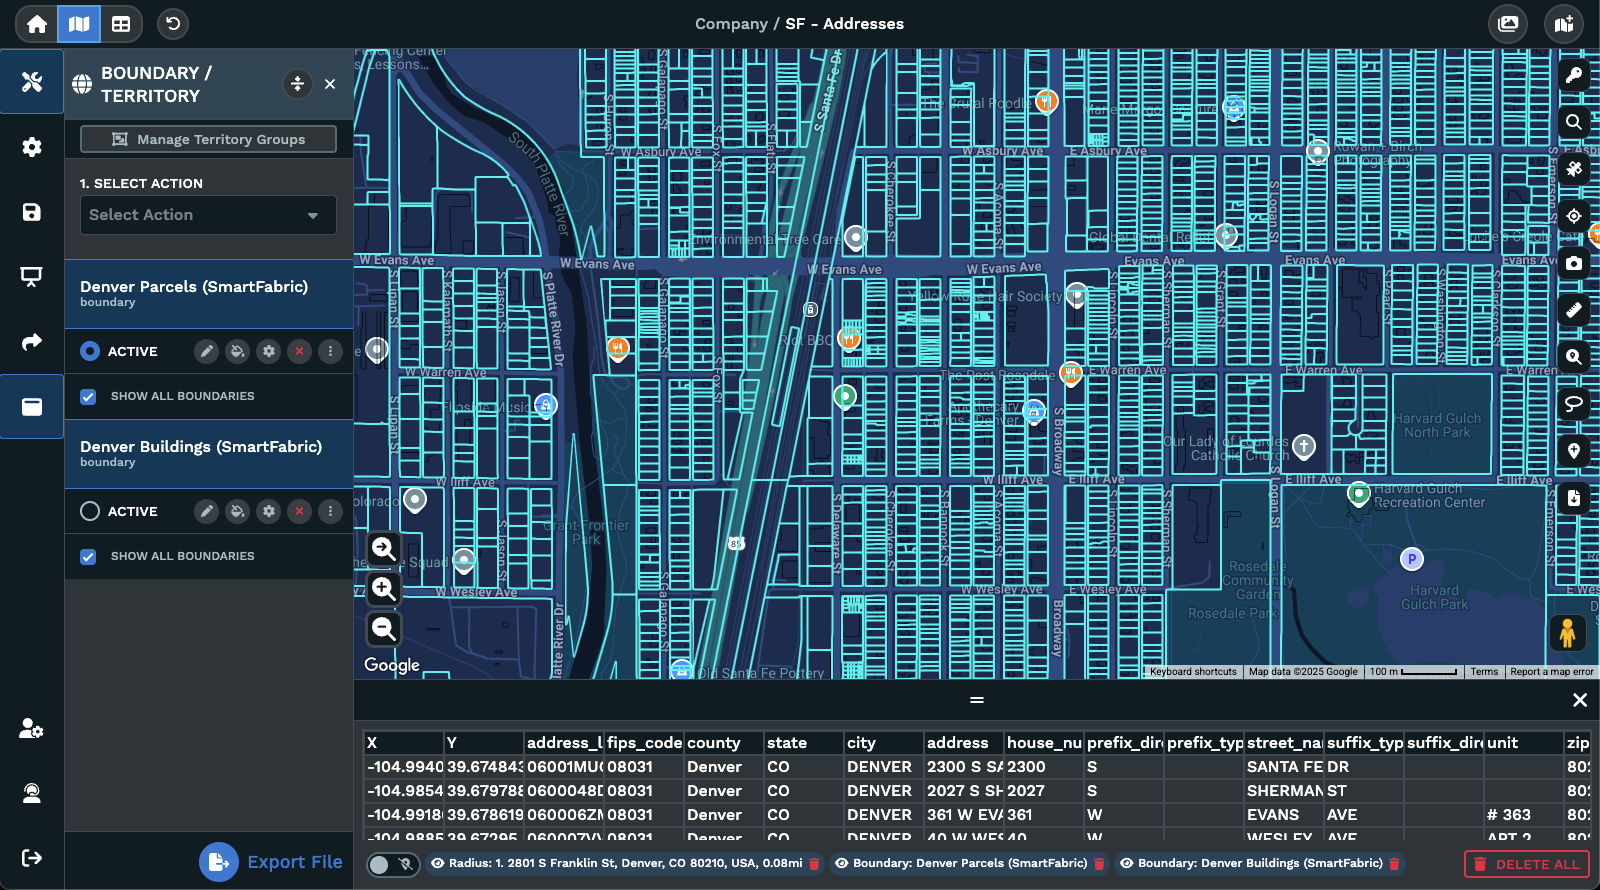
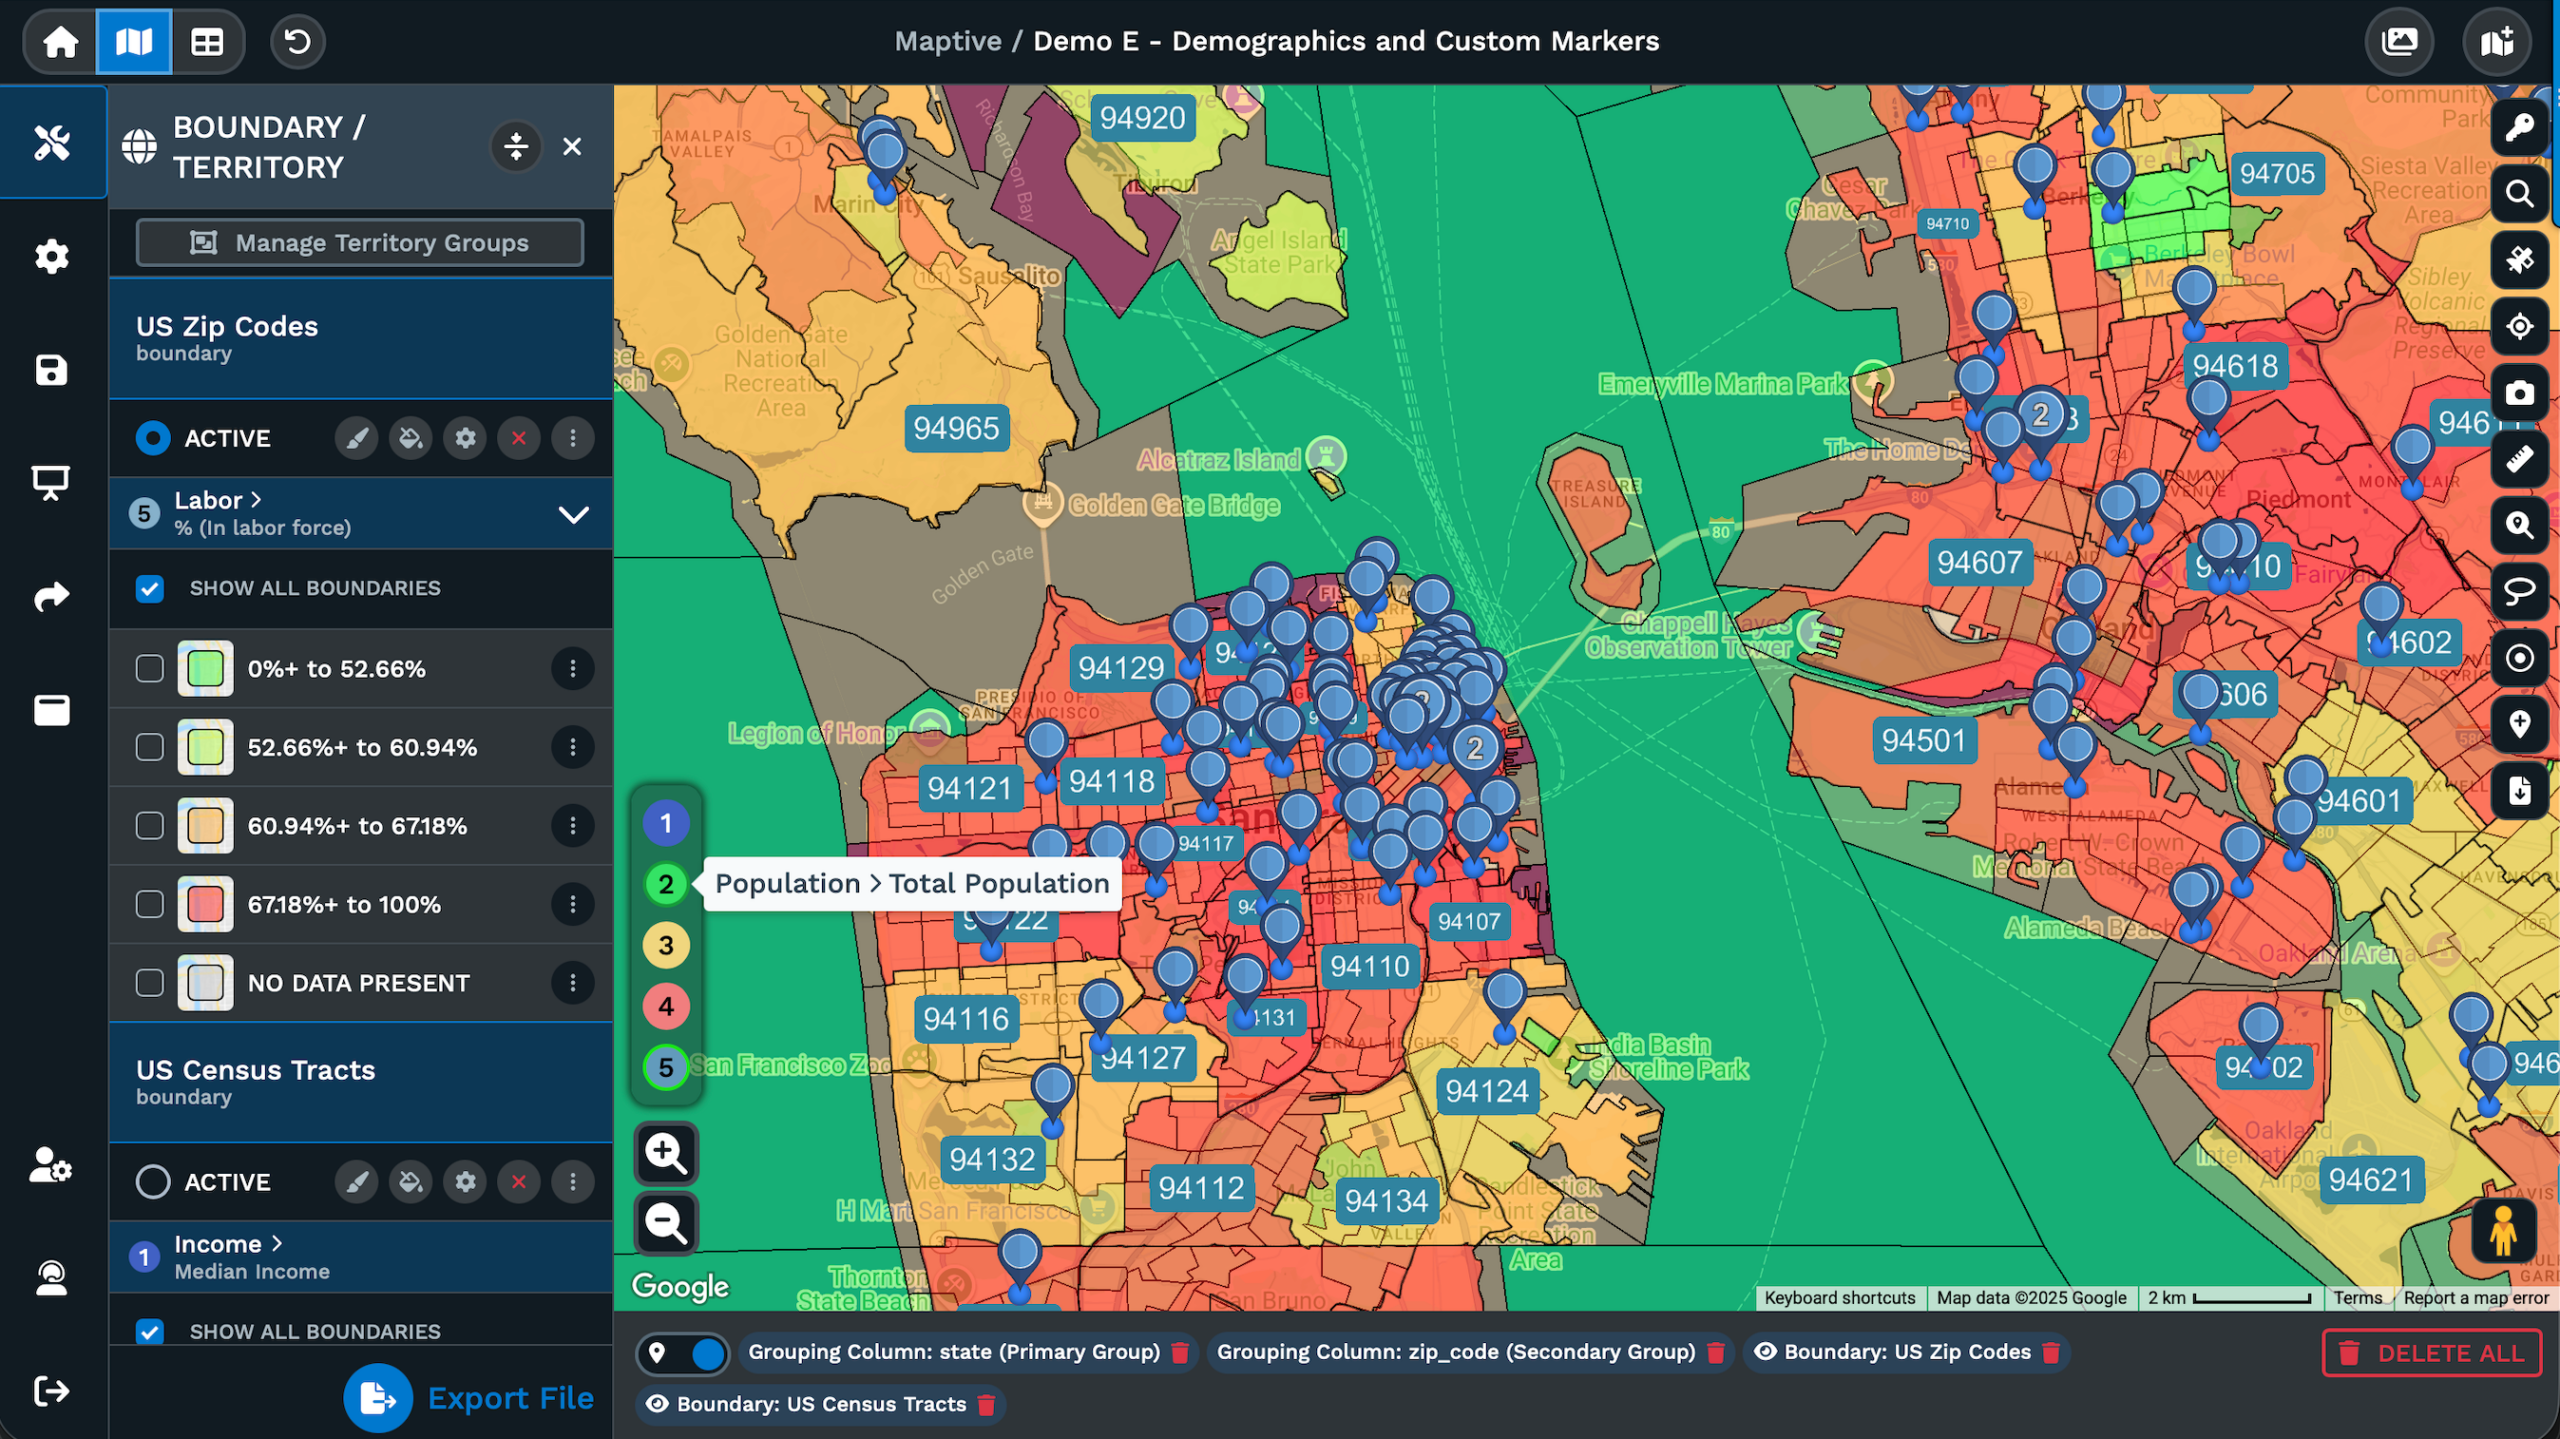
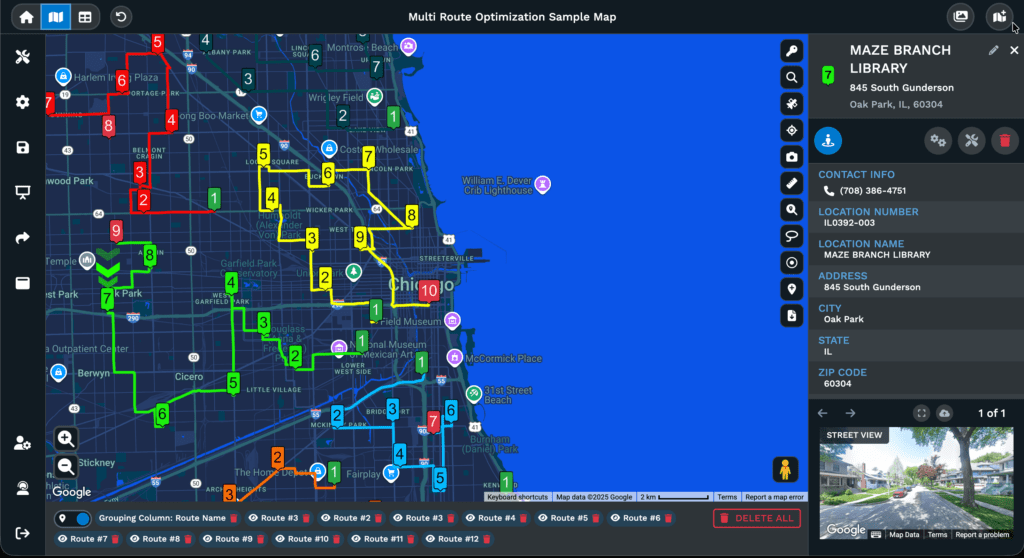
The platform’s territory management capabilities include AI-powered automated territory optimization that balances territories across multiple workload metrics simultaneously. Drive-time polygon analysis extends up to 8 hours, and the Maptive iQ engine uses 300% more calculation points than earlier versions of the tool, producing more granular and accurate coverage models. Route optimization handles up to multiple stops per route using Google’s Vehicle Routing Problem solver.
For data analysis, the platform provides heat mapping with weighted data fields, choropleth mapping, bubble maps, pie chart clusters, and multi-variable marker grouping. Demographic and census overlays cover 50+ variables at the state, county, ZIP code, census tract, and block group levels. The platform includes access to more than 100,000 data layers. A split-screen map and spreadsheet view lets users see the raw data alongside the visualization and update both in real time.
On the performance side, WebGL rendering handles 200,000+ markers without degradation, and the platform processes up to 100,000 location points per dataset. Maptive reported 99.9% uptime through 2025. Data import supports Excel, CSV, and Google Sheets formats.
CRM integration with Salesforce is live, with sub-90-second sync lag between the CRM and the map. HubSpot and Zoho integrations are currently in testing. REST API access is available on Pro and above.
Pricing breaks down as follows. The 45-Day Pass costs $250 and includes all tools for a single user, designed for short-term projects. Pro costs $1,250 per year or $110 per month for 1 user with API access and up to 100,000 locations per dataset. Team costs $2,500 per year or $220 per month and includes 5 user licenses, up to 500 maps, a dedicated success manager, and 15 million stored location records. Enterprise offers custom pricing for 10+ users with volume-based capacity. A 10-day free trial requires no credit card and includes all tools.
Support quality is a measurable differentiator. Maptive holds a 9.7 out of 10 support rating on G2, and phone, chat, and email support are available on all tiers, including the free trial. Team and Enterprise plans add a dedicated success manager.
Maptive is designed for business teams that need territory management, route planning, and location intelligence without hiring a GIS specialist or a developer. It is not designed for scientific spatial analysis, developer API integration into custom applications, or free casual use.
eSpatial: Purpose-Built Territory and Route Planning for Salesforce Teams
eSpatial occupies a focused position in this category. Its primary value is territory balancing and route planning built tightly around Salesforce integration, and teams that run their sales operations through Salesforce will find the connection between the two systems more deeply integrated than in most alternatives.
The platform uses a modular pricing structure with 3 components: eMapping for visualization and analysis, eRouting for route optimization, and eTerritory for territory management. This lets buyers pay for the specific capabilities they need rather than purchasing an entire platform. A 2025 update introduced account-based territory optimization using road network data, which means territories can be balanced based on actual drive times between accounts rather than simple geographic proximity.
eSpatial handles workload-based territory balancing, proximity analysis, and multi-stop route planning. Pricing sits at approximately $1,200 per user per year. The per-user model means costs scale linearly with team size, which can add up for larger sales organizations with 10 or more reps who need access. For teams already committed to Salesforce, the depth of that integration may offset the higher per-seat cost.
Where eSpatial narrows compared to more expansive platforms is in total tool count and data layer access. It does not offer 100,000+ data layers, and its demographic and census overlay capabilities are not as deep. If your primary need is tight Salesforce territory management and route optimization, eSpatial delivers that with precision. If you need a broad analytical toolkit that covers heat mapping, bubble maps, choropleth mapping, and extensive census data, a platform with a wider feature set may be the better fit.
Mapline: Budget-Friendly Entry Point for Smaller Teams
Mapline occupies the low end of this category’s pricing range, starting at $330 per year for the Standard plan. It provides spreadsheet copy-paste data import, dynamic pin mapping, and auto-generated territory boundaries. The Pro tier at $660 per year adds heat maps and additional analytical tools. A 7-day free trial is available.
The platform handles basic territory and visualization needs at a price point that makes it accessible to smaller teams and organizations with limited mapping budgets. For a team that needs to see its data on a map, draw some territories, and produce a few heat maps, Mapline covers that ground without a large financial commitment.
The tradeoffs are proportional to the price. Mapline lacks the CRM integration depth, processing capacity for large datasets, and breadth of analytical tools found in platforms at higher price points. Automated territory optimization, drive-time polygon analysis, and large-scale route planning are not areas where Mapline competes with more feature-rich alternatives. The platform handles geographic complexity reasonably for its price point, but teams with growing data volumes or increasing operational demands should evaluate if Mapline’s capacity ceiling will become a constraint within their first year.
If your team’s mapping needs are basic and your budget is limited, Mapline is a reasonable starting point. If your needs extend into automated territory balancing, CRM synchronization, or analysis of datasets exceeding tens of thousands of records, you will likely outgrow it.
Map Business Online: Mid-Range Option with Bundled US Demographic Data
Map Business Online sits at $500 to $900 per year and differentiates itself by bundling commercial-grade US data into the subscription. ZIP code boundaries, street-level maps, demographic data, and business listings are included rather than sold as separate add-ons. For teams that would otherwise need to purchase demographic data from a third-party provider, this bundling changes the cost calculation.
The Pro plan supports up to 250,000 location records and 1,500 territories per map. User reviews consistently note the platform’s intuitive interface, and the learning curve is shallow enough for business users to produce usable maps without training sessions.
The platform fits mid-sized, US-focused operations that need territory management with built-in demographic and business data. The bundled data offering eliminates a line item that would add hundreds or thousands of dollars annually on platforms that charge for data access separately.
The primary limitation is geographic scope. Map Business Online is built around US data. International teams will find coverage thin outside the United States, and organizations with global operations should look elsewhere. The platform also leans toward desktop use, which may matter for teams that need browser-based collaborative access across multiple offices.
If your territory management and demographic analysis work is concentrated in the US, and the $500 to $900 per year price point fits your budget, this platform delivers solid value for that specific use case.
Territory management and route optimization require analytical depth. But not every team needs that depth. The next category covers tools built for a simpler, faster job: turning a column of addresses into a visual map with minimal effort and no analytical overhead.
Online Mapping Software for Quick Visualization from Spreadsheet Data
When Spreadsheet-to-Map Visualization Is All You Need
You have a column of addresses in a spreadsheet. You want them on a map. You do not need territory management, route optimization, or demographic analysis. You need the addresses plotted, maybe color-coded or grouped, and you need it done in under 10 minutes.
The tools in this category do that one thing cleanly. They accept spreadsheet data, geocode the addresses, and produce a map you can view, share, or embed. Pricing ranges from free to $29 per month, data capacity is limited (typically hundreds to low thousands of locations), and analytical capability is minimal to nonexistent.
The tradeoff is proportional. What you gain in speed and simplicity, you give up in functionality and depth. None of these tools create territories, calculate drive times, overlay census data, or connect to your CRM. If you read that list and immediately thought “I need some of those things,” scroll back up to the business operations category. If you genuinely need a spreadsheet plotted on a map and nothing more, these 3 tools will handle that.
BatchGeo: Spreadsheet-to-Map Conversion with Low Learning Curve
BatchGeo’s core promise is speed. Copy a set of addresses from a spreadsheet, paste them into the website, and receive a map built on a Google Maps base layer. No account is required for basic use. The entire process, from opening the website to viewing a finished map, can take under 5 minutes.
The free plan supports up to 250 locations per map. BatchGeo Lite costs $15 per month and increases the limit to 15,000 locations with support for 3 users. The Pro plan at $99 per month adds route optimization capped at 25 stops. An annual prepaid option covers up to 25 users at $2,499.
What BatchGeo lacks defines it as clearly as what it offers. There is no CRM integration. No territory management. No demographic overlays. No analytical tools beyond basic pin grouping and filtering. The platform is designed for speed, and it delivers on that specific promise.
The honest assessment is this: if you need a visual of your data in under 5 minutes and have no interest in deeper analysis, BatchGeo does exactly what you need. If you need anything beyond plotting addresses and basic color grouping, you will outgrow it within weeks. The 250-location free tier is particularly limiting for any business use beyond a quick proof-of-concept. Teams that find themselves repeatedly hitting the cap or wanting filtering and analytical capability beyond what BatchGeo offers should evaluate business mapping platforms in the first category of this guide, where tools are built for sustained operational use rather than quick one-off visuals.
EasyMapMaker: Simple Pin Mapping for Small Teams
EasyMapMaker costs $29 per month and does what its name implies. Upload a spreadsheet, and the platform generates a map with customizable pin colors, labels, and grouping. Paid plans add boundary overlays for ZIP codes, counties, and states.
The learning curve is near zero. A new user can produce a presentable map within minutes, and the output is clean enough for internal presentations, marketing materials, or event planning. The feature set is deliberately narrow: no route planning, no territory balancing, no CRM connectivity, no demographic data.
Small teams that need to produce clean-looking pin maps without committing to a full mapping platform will find EasyMapMaker adequate for that narrow purpose. The output is presentable for internal meetings, client reports, or marketing collateral that requires a geographic visual without analytical depth. The moment a team needs to plan routes, balance territories, or analyze data layered onto a map, EasyMapMaker’s utility is exhausted.
Atlist: the Best Option for Embedding Interactive Maps on Websites
Atlist serves a different need within this category. Rather than analyzing data, it creates interactive maps designed for public-facing website embedding. You can add markers manually or import them from a spreadsheet or CSV file. Each marker supports photos, turn-by-turn directions, descriptions, and custom icons. Thousands of map styles are available through Snazzy Maps integration, and the output is mobile-responsive and embeddable on any website.
The platform fits small businesses, tourism boards, event organizers, and anyone who needs a polished store locator, city guide, or venue map on their website without hiring a developer. The output looks professional, loads quickly on mobile devices, and the setup requires no coding knowledge.
Atlist is not a GIS tool. It is not a data analysis platform. It does not handle territory management, route optimization, or large dataset processing. It handles the narrow task of creating good-looking, interactive, embeddable maps, and within that narrow task, it performs well. If your primary need is a customer-facing interactive map on your website, Atlist solves that problem without requiring you to learn a full mapping platform or hire a developer.
The tools above assume you want a ready-to-use interface. The next category assumes the opposite: you are a developer who wants to build mapping functionality into your own application, with full control over every visual and functional element.
Mapping Software APIs for Developers Building Custom Applications
What Makes Developer Mapping Platforms Different from Ready-to-Use Tools
These are not tools a business user logs into. They are infrastructure. APIs and SDKs that developers write code against to embed maps, routing, geocoding, or spatial queries into custom applications. The value is total control over the user interface, functionality, and visual identity of the map. The cost is development time and technical skill.
You belong in this category if you are building a product that incorporates maps. Delivery tracking apps, ride-sharing platforms, real estate search portals, logistics dashboards, and fleet management systems all require developer-level mapping infrastructure. If you do not have developers on staff, these tools are not for you.
The distinction from business mapping tools is functional, not qualitative. A business mapping platform gives you a finished interface where you upload data and get results. A developer API gives you building blocks that your engineering team assembles into exactly the product you need. The first requires no code. The second requires nothing but code.
Mapbox: Maximum Customization for Branded Map Products
Mapbox holds 26.98% market share according to 6sense data and serves more than 70,000 customers. It provides APIs and SDKs for JavaScript, Python, iOS, and Android. Mapbox Studio lets development teams design custom base maps from scratch, controlling every visual element down to road color, building geometry rendering, and label typography.
The platform supports offline maps for mobile applications, turn-by-turn navigation, geocoding, and address search. Pricing follows a usage-based model: the first 50,000 map loads per month are free, with charges of $5 per 1,000 loads after that.
Multiple user reviews on Capterra flag a cost concern worth noting. The Static Tiles API pricing is notably higher than comparable endpoints from competing developer platforms. At high volume, the cost difference adds up.
Mapbox is the right fit for development teams building consumer-facing products where the map’s visual identity and functional behavior must be fully custom and on-brand. Companies that need their maps to look and feel like their product, rather than like a Google Maps embed, gravitate toward Mapbox for that reason. It is not suitable for business users without developers, and it is not a tool you can hand to a sales manager or operations coordinator.
Google Maps Platform: the Global Standard for Developer Map Integration
Google Maps Platform is the most widely used mapping API globally. The pay-as-you-go model includes a $200 monthly credit that covers approximately 28,000 map loads or 40,000 direction calls per month. Beyond the credit, charges apply per API call.
The platform’s primary advantages are global address data coverage and satellite imagery that no competitor matches, paired with the consumer familiarity that comes from being the default map on billions of devices. For public-facing applications where users expect the Google Maps interface, that familiarity reduces friction. Users already know how to zoom, pan, search, and switch between map and satellite views.
The cost concern is real and well documented. At scale, Google Maps Platform pricing climbs steeply, and because charges are usage-based, costs can be difficult to forecast for applications with variable traffic. A spike in usage can produce an unexpectedly large bill. Teams building on this platform need to monitor usage closely and set budget alerts through the Google Cloud console.
Google Maps Platform is a developer tool. It does not include a business user interface for territory planning, route optimization, or data analysis. Some business mapping platforms (including Maptive) are built on top of Google Maps infrastructure and provide the business-facing interface that Google itself does not. If your development team is building a consumer-facing application that requires the most recognized map interface and the most globally accurate address data, Google Maps Platform is the standard for a reason.
Leaflet: Free, Open-Source, and Developer-Controlled with No Vendor Lock-In
Leaflet is a free, open-source JavaScript library weighing approximately 42 KB. It handles tile layers, markers, popups, and basic vector drawing. There are no licensing fees, no usage charges, and no vendor contracts.
What Leaflet does not include is equally important. There is no built-in geocoding, routing, or data analysis. Those capabilities are added through plugins or by connecting to external APIs (including Mapbox tiles, Google geocoding, or OpenStreetMap data). Leaflet is a starting point, not a finished product.
The platform works with OpenStreetMap, Mapbox tiles, or any tile provider that follows web mapping standards. It runs on any modern browser without proprietary dependencies.
The fit is specific: organizations that want to avoid vendor lock-in, have developers who can assemble a full-featured mapping application from individual components, and want zero licensing cost. The tradeoff is assembly time. A team using Leaflet builds everything themselves, from geocoding to routing to analysis. For teams willing to invest that development time, the payoff is complete control with no ongoing platform fees. For teams that need a working mapping solution within days rather than months, Leaflet’s assembly-required model may not match the timeline.
Developer tools give technical teams full control over map functionality. But some organizations need analytical power that goes deeper than any API or business mapping tool can provide. Spatial queries across millions of features, coordinate system management, custom projections, and workflows that require geospatial expertise belong to a different class of software entirely.
Enterprise GIS Platforms for Full-Scale Spatial Analysis
When Your Organization Actually Needs Enterprise GIS
Enterprise GIS is for organizations that employ GIS professionals or need to perform spatial analysis at a scientific, engineering, or governmental level. Raster and vector data processing, coordinate system management, terrain modeling, watershed analysis, network analysis, and Python-scripted spatial workflows are the defining capabilities.
Government agencies, utility companies, urban planners, environmental scientists, and engineering firms are the core audience. According to research published by GREY Journal, ArcGIS serves 70% of the largest global companies and 95% of the largest national governments. That adoption pattern tells you who this category is built for.
If your need is “plot customer locations and balance territories among sales reps,” enterprise GIS is overbuilt for your situation. If your need is “analyze flood risk across a watershed using LIDAR data and model infrastructure impact under multiple climate scenarios,” enterprise GIS is the only category that applies. The 3 platforms below represent the range of options within this category, from the commercial industry standard to a free open-source alternative to a mid-range desktop hybrid.
ArcGIS Online: the Industry Standard with Unmatched Depth and Corresponding Complexity
ArcGIS Online, operated by Esri, holds 26.88% of the GIS market according to 6sense data and serves more than 70,000 customers. It is the reference standard against which every other GIS platform is measured.
The Business Analyst Web App Standard provides tools for analysis, maps, reports, and infographics using Esri’s global data covering 170+ countries and 15,000+ variables. User type licensing offers 6 options aligned to different workflows, functioning as annual licenses tied to specific capability levels.
ArcGIS Pro 3.6 launched in November 2025 with a redesigned ModelBuilder interface. ArcGIS Pro 3.7 is planned for Q2 2026 and will require .NET 10. ArcGIS Enterprise 12.0 removes legacy components including Web AppBuilder and Map Viewer Classic, consolidating around a newer development framework. Organizations currently running legacy components will need to plan their migration path.
The depth of the ArcGIS ecosystem is unmatched. It handles everything from basic map visualization to complex geoprocessing, 3D analysis, and spatial machine learning. The user type licensing model offers 6 tiers aligned to different workflows, so organizations can assign each team member the appropriate access level rather than paying for full capability across every seat. No business mapping tool, developer API, or quick-visualization platform comes close to this range of analytical capability.
That depth comes with proportional costs. Enterprise pricing creates barriers for smaller organizations. The learning curve requires weeks of dedicated effort to become proficient, and that estimate comes not from marketing materials but from consistent patterns in user reviews on G2 and Capterra. The volume of tools and configuration options exceeds what most business teams need, and paying for capabilities you will never use is an inefficient allocation of budget.
ArcGIS fits organizations with dedicated GIS staff, existing Esri infrastructure investments, or needs that extend into scientific research, government planning, environmental analysis, or engineering-grade spatial work. If none of those descriptions match your team, you are in the wrong category.
QGIS: Professional-Grade GIS at Zero Licensing Cost
QGIS is the free, open-source alternative to ArcGIS, and the “free” part deserves context. There is no licensing fee, no subscription cost, and no usage charge. The software is available on Windows, macOS, and Linux.
In terms of capability, QGIS handles raster, vector, mesh, and point cloud layers. It reads nearly every major geospatial format including Shapefiles, GeoJSON, GeoTIFF, GeoPackage, and PostGIS databases. Thousands of community-built plugins extend its functionality. The QuickMapServices plugin alone has been downloaded more than 7.2 million times.
QGIS 4.0 arrived in October 2025, and QGIS 4.2 follows in February 2026 as the next long-term support release. The QField mobile app, which brings QGIS data collection to the field, has accumulated 1.4 million downloads and 500,000 active users. Felt became QGIS’s first flagship sustaining member in 2023, providing financial support for the open-source project.
The tradeoff is technical overhead. QGIS does not offer drag-and-drop simplicity, one-click territory builders, or customer support teams. The learning curve tracks closer to ArcGIS than to any business mapping tool. Desktop processing is CPU-bound, so QGIS is not designed to handle millions of features or terabytes of raster data at processing speeds that enterprise cloud infrastructure can achieve. For heavy compute workloads, tools like DuckDB or Apache Sedona handle that side of the workflow.
QGIS fits organizations that have GIS expertise in-house (or willingness to develop it) and want professional-grade tools without the licensing cost. It is not a tool you hand to a sales manager and expect usable territory maps within a week.
Maptitude: Desktop-First GIS with Bundled US Data at a Mid-Range Price
Maptitude is primarily a desktop application priced at $695 per user per year, with limited online capabilities. The subscription includes built-in US demographic, economic, and geographic data, with additional country packages available for purchase.
The platform supports territory management, drive-time analysis, route planning, site selection, delivery optimization, and isochrone calculations. Map customization covers colors, labels, legends, and themes. For organizations that need more analytical depth than business mapping tools provide but less than full ArcGIS, Maptitude occupies that middle ground.
A consistent criticism across user reviews is worth noting: both the cloud and desktop versions are difficult to master, and the platform’s support documentation has not kept pace with newer feature updates. Users report that learning the interface requires patience and self-directed exploration. The desktop-first architecture also means that collaboration between team members is less fluid than on cloud-native platforms where multiple users can access the same project simultaneously.
Maptitude fits US-focused organizations doing location analysis that want bundled demographic data without ArcGIS pricing, provided the team can absorb a learning curve that sits meaningfully above business mapping tools. International coverage is available through add-on packages but is not the platform’s primary focus.
Enterprise GIS handles spatial analysis at a technical level. A newer segment of the market has emerged for organizations that treat geographic data as a strategic business input without needing full GIS workflows. Data science teams running spatial queries against cloud data warehouses with millions of records operate in this space.
Location Intelligence Platforms for Spatial Data Science
What Location Intelligence Means and How It Differs from GIS and Business Mapping
Location intelligence refers to the practice of deriving business insights from spatial data at scale, typically by connecting analytical tools to cloud data warehouses like BigQuery, Snowflake, Redshift, or Databricks where the organization’s data already lives. Analysis runs against data in place, without extraction or replication into a separate system.
It differs from GIS in that the orientation is toward business outcomes rather than scientific analysis. A GIS specialist models terrain and processes satellite imagery. A location intelligence analyst asks which retail zones are underperforming relative to foot traffic density and competitor proximity.
It differs from business mapping in that the user works with millions of records and SQL-level data manipulation rather than spreadsheet uploads and point-and-click interfaces. The audience is data scientists, business intelligence analysts, and analytics teams in mid-to-large enterprises that already have their data organized in cloud infrastructure. If your team does not have a data warehouse, this category is not for you.
CARTO: Cloud-Native Spatial Analytics for Teams Already on BigQuery or Snowflake
CARTO is a cloud-native platform that connects directly to BigQuery, Snowflake, Amazon Redshift, and Databricks. Analysis runs against data where it lives, and the architecture avoids the extraction and replication workflows that slow down teams working with large spatial datasets.
CARTO Workflows provides a low-code drag-and-drop interface for building spatial analytics pipelines. CARTO Builder handles map visualization. AI Agents, introduced in 2025, allow natural language querying of spatial data, which lets users ask questions of their geographic datasets in plain language rather than writing SQL. Clients include Coca-Cola, Vodafone, JLL, and Deliveroo.
Pricing starts at $199 per month for the Individual plan, which includes 2 GB of storage, 0.5 TB of daily compute, and 100,000 map loads. Enterprise pricing is custom. A 14-day free trial is available.
CARTO is not for small businesses that want to see customers plotted on a map. The platform assumes you already have spatial data organized in a cloud data warehouse and need analytical tools that work at that scale. Performance depends on how well the underlying data warehouse is structured, and advanced features like SQL-based spatial analysis require time to learn. The Individual plan at $199 per month is a reasonable entry point for evaluation, but the platform’s full value surfaces at the Enterprise tier where compute capacity and storage match the scale of larger datasets. For data science teams already operating in BigQuery or Snowflake, CARTO adds spatial analysis capability without moving data out of existing infrastructure.
Felt: Collaborative Cloud Mapping That Bridges GIS Specialists and Business Teams
Felt launched in 2021 and occupies a position that did not previously exist in the market. It is a collaborative, cloud-native mapping platform that processes any standard geospatial file format (Shapefile to GeoJSON) in seconds, with sub-300-millisecond load times compared to 30+ seconds on many traditional platforms.
The platform’s distinguishing feature is real-time multi-player editing. Multiple users can work on the same map simultaneously, which moves spatial work off a single GIS specialist’s desktop and into a shared, live format accessible across departments. A built-in library of 50+ curated data layers provides ready-to-use reference data. SOC 2 Type 2 compliance addresses enterprise security requirements.
Enterprise features include database connections to Postgres, Snowflake, BigQuery, Databricks, and S3. Dashboards with charts and H3 analytics (hexagonal spatial indexing) support more advanced analysis. Mobile survey deployment lets field teams collect location data directly. Felt became QGIS’s first flagship sustaining member in 2023, funding the open-source ecosystem it works alongside.
The Team plan supports up to 25 people with 3 editors. Enterprise pricing is custom. A 7-day free trial is available.
Felt fits organizations that need to get spatial work out of siloed desktop environments and into a shared, collaborative format. Teams where a single GIS analyst produces maps that 15 other people need to access, annotate, and discuss will find the collaborative model solves a workflow bottleneck that traditional GIS tools do not address. It is not designed for heavy computational GIS or business-specific tools like automated territory optimization and multi-stop route planning.
With all 15 platforms covered across 5 categories, you have the information needed to identify your category and shortlist 2 to 3 tools. But choosing well also means avoiding the mistakes that lead teams to buy the wrong platform.
5 Mistakes That Lead Teams to Choose the Wrong Mapping Software
Mistake: Evaluating Mapping Software with Sample Data Instead of Your Real Dataset
This is the most common and most costly error. Vendor demos use small, clean, perfectly formatted datasets. Your actual data has 50,000 rows with messy addresses, missing ZIP codes, inconsistent formatting, and duplicate entries.
A tool that performs beautifully on 100 sample records may freeze on your actual 40,000-record export from Salesforce. The only valid performance test is uploading your real dataset during the trial period. If the platform cannot handle your data at its actual size and messiness, nothing else about the tool matters. Export your real data before starting any trial so you can import it on day one.
Mistake: Choosing a GIS Platform When You Need a Business Mapping Tool
Teams that buy ArcGIS for sales territory management end up with a platform no one on the team can operate. Weeks of training lie ahead, the budget hit exceeds what a purpose-built business mapping tool would cost by a factor of 3 or more, and the team’s actual needs (plot customers, balance territories, plan routes) represent roughly 5% of what the GIS platform can do.
Match the tool category to the problem. A GIS platform’s technical prestige is irrelevant if the team that needs to use it lacks GIS training. Start with the simplest tool category that covers your requirements and move up only if you hit a capability ceiling during testing.
Mistake: Selecting Based on Feature Count Without Testing Feature Depth
A platform advertising “100+ features” tells you nothing about how well any single feature performs for your use case. Territory management exists in multiple tools across this guide, but the depth ranges from “draw a polygon on a map manually” to “algorithmically balance 50 territories across 6 workload metrics while accounting for drive time and account value.”
Feature lists are marketing materials. Feature depth is operational reality. During your trial, test the 3 to 4 features you will use daily and evaluate how each one handles your specific workflow. A platform with 20 features that each perform well for your needs is more valuable than a platform with 200 features where the 3 you rely on are shallow.
Mistake: Ignoring Long-Term Cost When Choosing the Cheapest Option
The cheapest tool becomes the most expensive when the team outgrows it within 6 months and must migrate to a new platform. Migration costs include rebuilding every territory, re-importing and re-geocoding all data, retraining every user on a new interface, and absorbing lost productivity during the transition period.
Calculate the 12-month total cost that includes your realistic growth scenario. A platform at $1,250 per year that lasts 3 years costs less than a platform at $330 per year that you replace after 8 months. Factor in the hours your team will spend rebuilding territories, re-importing data, and relearning workflows on the replacement platform.
Mistake: Assuming Free Mapping Tools Are Sufficient for Ongoing Business Use
Free tools and free tiers have legitimate uses. One-off projects, proof-of-concept presentations, personal use, and quick internal visuals are all reasonable applications. For ongoing business operations, free tools impose limitations that are incompatible with daily use: data caps (often 250 to 1,000 locations), watermarked outputs, no CRM integration, and no support when something breaks.
A free tier is a valid starting point for evaluation. It is not a valid long-term solution for teams that depend on mapping data to make operational decisions every week. If your mapping needs are ongoing and affect revenue or resource allocation, budget for a paid tool and treat free trials as what they are: evaluation periods.
Avoiding these mistakes narrows the field. But the final decision comes down to hands-on testing during trial periods.
How to Test Online Mapping Software Before You Commit
Step 1: Import Your Actual Data on Day One of the Trial
Within the first hour of any trial, upload your real dataset. Not a sample. Not a test file. Your actual export from your CRM, spreadsheet, or database, at full size and in its native format (Excel, CSV, Google Sheets). Note how the platform handles messy addresses, missing fields, and formatting inconsistencies without requiring manual cleanup before import.
Step 2: Test the 3 Features You Will Use Weekly
Identify the 3 tasks you will perform most often and run each one through the platform during the trial. If you need territory assignment, create actual territories with your real account data. If you need route planning, build an actual route with your real stop list. Time how long each task takes and evaluate if the output is something your team can use for actual decision-making.
Step 3: Share a Map with a Non-Technical Colleague and Observe Their Reaction
The best usability test is this: can someone who did not build the map read and interpret it without explanation? Share a completed map with a colleague who has never seen the platform. If they can understand the information and draw conclusions from it without your narration, the tool passes the adoption test. If they stare at it and ask what they are looking at, the tool may be too complex for broad team use. This test matters because the person who evaluates mapping software is rarely the only person who will use it.
Step 4: Contact Support with a Real Question Before Your Trial Expires
Do not wait until after purchase to find out what the support team is like. During the trial, send a specific, non-trivial question through the platform’s support channel. Ask something about your actual use case, not a generic “how do I” question that documentation can answer. Measure response time, evaluate if the answer addresses your specific situation, and note if the support team understands business applications or only provides links to generic help articles.
The framework above covers the full evaluation process: category identification, evaluation criteria, platform reviews, mistake avoidance, and a testing methodology. The FAQ below answers remaining cross-cutting questions that span multiple categories.
Frequently Asked Questions About Online Mapping Software
What Is the Best Mapping Software for Small Businesses?
The answer depends entirely on what the small business needs. For basic spreadsheet-to-map visualization with no analytical requirements, BatchGeo or EasyMapMaker handles the job at $0 to $29 per month. For territory management, route planning, and business analytics without GIS complexity, a dedicated business mapping platform in the $250 to $2,500 per year range fits. For embedding a store locator or interactive map on a website, Atlist is purpose-built for that task. Small businesses with development resources building map-enabled applications should evaluate developer APIs. The “best” tool is the one that matches the specific problem the business is solving, and the pricing tier that matches the budget without sacrificing the features used daily.
How Much Does Online Mapping Software Cost in 2026?
Pricing varies by category. Quick-visualization tools range from free to $99 per month. Business mapping platforms run $250 to $2,500 per year. Developer APIs use usage-based pricing with free tiers (Mapbox charges $5 per 1,000 loads after 50,000 free monthly loads; Google Maps Platform includes a $200 monthly credit). Desktop GIS starts at $695 per year for Maptitude and extends to custom enterprise pricing for ArcGIS. Location intelligence platforms start at $199 per month for CARTO’s Individual plan, with custom enterprise tiers above that. The widest variation exists in business mapping, where a 45-day project pass may cost $250 while an annual team license runs $2,500.
What Mapping Software Integrates with Salesforce?
eSpatial has the deepest Salesforce integration among platforms reviewed in this guide, with territory management and route planning built directly around Salesforce data structures. Business mapping platforms in the operations category generally offer CRM connectivity at varying depth levels, with some providing live sync and others requiring periodic re-import. Developer APIs can be integrated with Salesforce through custom development work, though this requires engineering resources and ongoing maintenance. Quick-visualization tools and open-source GIS tools typically lack CRM integration entirely. If Salesforce integration is a hard requirement, your shortlist narrows to the business operations category.
How Many Locations Can Online Mapping Software Handle?
Capacity ranges vary by category and by platform within each category. Quick-visualization tools cap between 250 and 15,000 locations. Business mapping platforms typically handle 50,000 to 250,000 markers, with some platforms supporting higher volumes through WebGL rendering and optimized data processing. Enterprise GIS scales to millions of features but requires infrastructure and expertise. Developer APIs scale with the infrastructure investment behind them.
Published capacity numbers from vendors represent maximum loads, not guaranteed performance levels. A platform that claims 200,000 markers may render them all but slow down when you try to filter, group, or interact with the map at that volume. The only reliable test of capacity is loading your actual dataset during a trial and observing performance at your real data volume under your actual usage patterns.
Is Open-Source Mapping Software Good Enough for Business Use?
QGIS and Leaflet are capable tools with zero licensing cost, but “good enough” depends on who is using them. QGIS provides professional-grade GIS capabilities and reads virtually every geospatial format, but it requires GIS knowledge, self-directed learning, and tolerance for community-based support with no guaranteed response times. Leaflet provides a mapping foundation for developers but requires assembly from individual components. Neither offers the ready-to-use territory management, route optimization, or CRM integration that business teams need on day one.
Open-source is a strong option for organizations with technical staff who can invest the setup and learning time. It is not a shortcut for teams that need a tool that produces usable output within hours of signing up. The question is not “is the software capable?” but “does the team have the skills and time to make it productive?”
What Features Should I Look for in Mapping Software?
The 6 evaluation criteria covered earlier in this guide (data capacity, pricing model, learning curve, CRM integration, scalability, and support quality) apply across all categories, but the weight you assign each one depends on your situation. A developer evaluating APIs cares about documentation quality, customization depth, and per-call pricing. A sales director evaluating business mapping tools cares about CRM synchronization speed, territory automation accuracy, and if the team can use it without training. A GIS analyst evaluates based on format support, analytical depth, and scripting capability. There is no universal feature checklist because the right features depend on the problem you are solving.
How to Get Started with Maptive for Business Mapping
What Maptive’s Free Trial Includes and How to Begin
Maptive’s free trial runs for 10 days with no credit card required. All 60+ tools are available immediately during the trial period, with no feature gating or capability restrictions. This means you are testing the actual platform, not a stripped-down preview.
The starting process is direct. You upload your data in Excel, CSV, or Google Sheets format, and the platform geocodes addresses automatically. The geocoding process handles common formatting inconsistencies (mixed abbreviations, missing ZIP codes, varied address formats) without requiring manual data cleanup before import. Most users report having a working, filterable map with visualization options active within 30 minutes of first login. From there, you can test territory creation, route planning, heat mapping, demographic overlays, and any of the other 60+ tools against your actual data during the 10-day window.
Support is available during the trial on every tier, including phone, chat, and email. This is not documentation-only support. The team offers live training sessions where a support representative walks through your specific data and use case, helping you configure the platform for your actual workflow rather than a generic demo scenario. Maptive’s G2 support rating of 9.7 out of 10 reflects this approach.
Pricing Plans and Which Tier Fits Your Team Size
- The 45-Day Pass costs $250 and includes all tools for a single user. It is designed for short-term projects, consultants working on a defined engagement, or teams that need a one-time mapping output without committing to an annual plan.
- Pro costs $1,250 per year or $110 per month. It includes 1 user license, all tools, API access, and support for up to 100,000 locations per dataset. Additional Pro licenses cost $750 each. This tier fits solo users and small businesses that need ongoing access to the full mapping and analysis toolkit.
- Team costs $2,500 per year or $220 per month. It includes 5 user licenses, up to 500 maps, a dedicated success manager, and storage for 15 million location records. Additional Team licenses cost $500 each. This tier fits multi-user teams that need shared access, collaborative mapping, and higher data capacity.
Enterprise offers custom pricing for organizations needing 10+ user licenses with volume-based data capacity. Contact Maptive directly for Enterprise pricing.
Every plan includes every tool. The tiers differ by user count, data capacity, and support level. A solo user on the Pro plan has access to the same territory optimization, heat mapping, route planning, and demographic overlay tools as a 20-person Enterprise deployment. This flat feature model means you evaluate Maptive based on how many users and how much data you need, not on which features you can access at which price point.


