

San Francisco has spent decades building one of the most effective urban recycling systems in the United States. What began with community-driven drop-off centers in the 1970s became a comprehensive citywide program by the early 2000s. Through a mix of regulation, infrastructure, and public engagement, the city now diverts about 80% of its waste from landfills. Here, you can learn how San Francisco achieved that level of performance—and what other cities can learn from its approach.
How San Francisco Built a Recycling System That Outperformed the Rest of the U.S.
San Francisco’s waste management efforts began more than a century ago, with immigrant workers salvaging usable materials from trash in what were effectively early recycling practices. By 1921, the city had formalized waste collection through two companies operating under exclusive licenses, forming a lasting public-private arrangement.
Community-based recycling gained traction in the 1970s. Residents opened volunteer-run drop-off centers, which grew to ten by 1980. That year, the city launched the San Francisco Recycling Program as part of its Solid Waste Management Program. A curbside recycling pilot followed in the early 1980s.
California’s Bottle Bill, passed in 1986, introduced a cash refund system for beverage containers and helped increase statewide recycling rates. San Francisco set its own goals in 1988, targeting a 32% diversion rate by 1992, and then aligned with AB 939, which mandated 25% diversion by 1995 and 50% by 2000. The city reached 27% diversion by 1990, one of the highest rates nationally at the time.
To meet the state mandate, San Francisco expanded curbside recycling to include paper, glass, aluminum, and plastics. By 1991, the expanded program was fully operational. A 1996 audit showed that compostable food waste accounted for 26% of what was being sent to landfill. The city responded with food scrap composting pilots that year, eventually expanding them citywide by 2000. San Francisco reached its 50% diversion target on schedule.
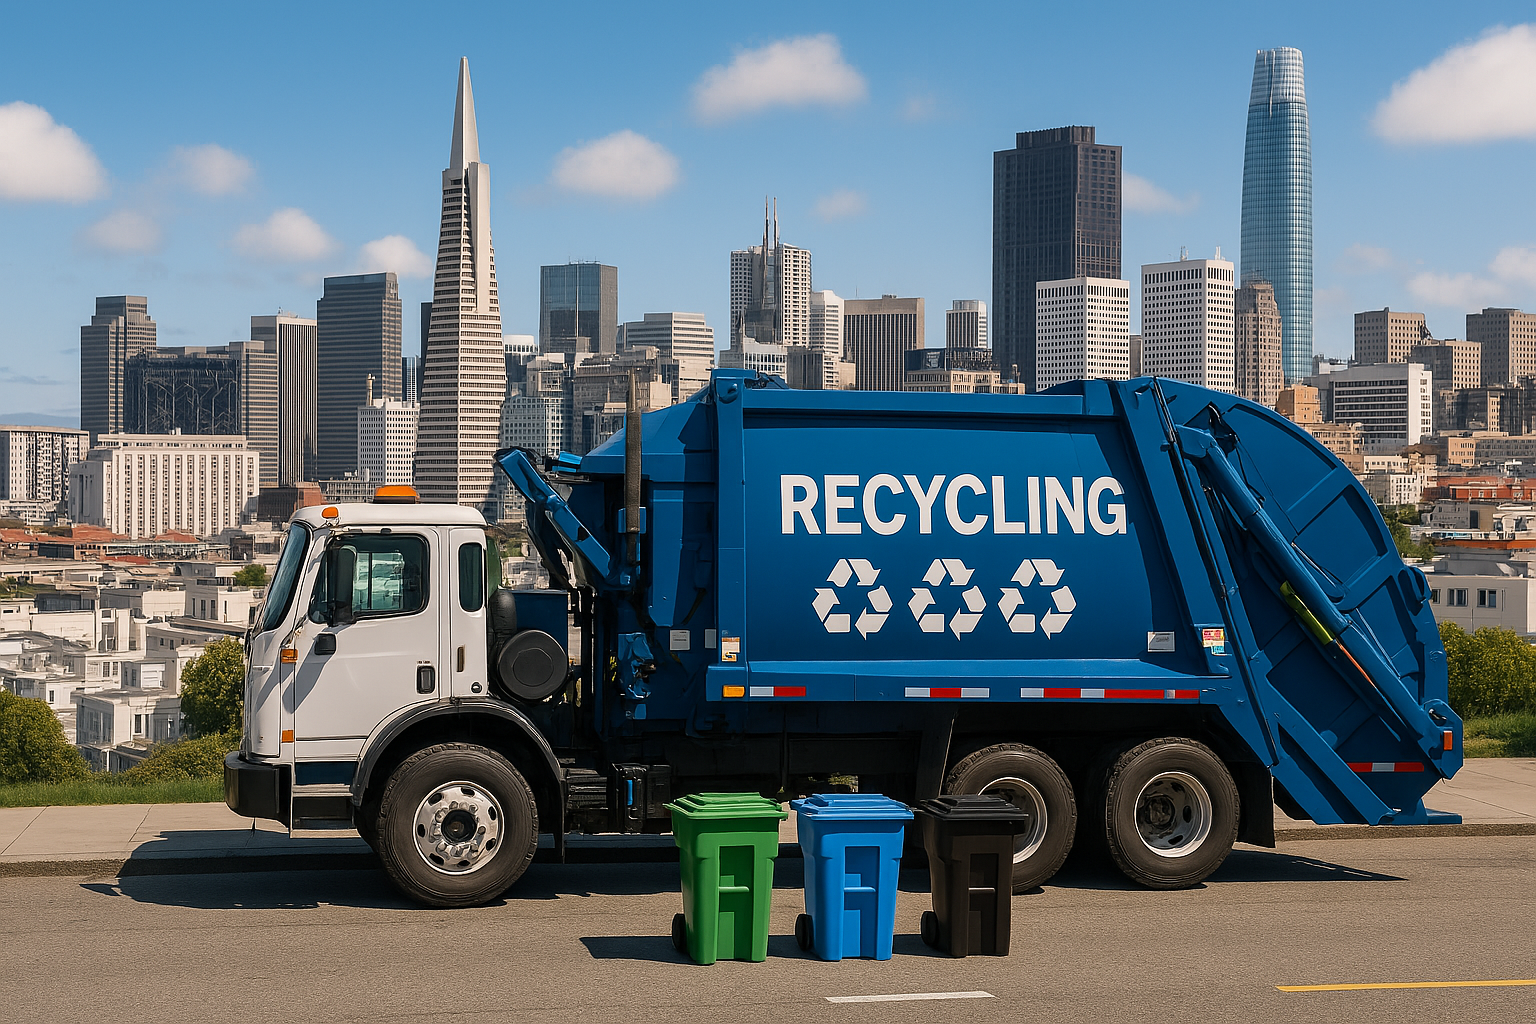
In 2002, the Board of Supervisors adopted a Zero Waste Goal, aiming for 75% diversion by 2010 and zero waste by 2020. To support this, the city and Recology had already introduced the three-bin system in 1999—blue for recyclables, green for compostables, and black for landfill waste. The bins were paired with a pricing system that incentivized lower waste generation. Within months of rollout, diversion among participating households exceeded 90%. By 2007, San Francisco had reached a 72% diversion rate.
Several waste-reduction ordinances during the 2000s further accelerated progress:
- 2004 – Green Building Ordinance: Required recycling space in new city buildings and management of construction debris.
- 2006 – Construction & Demolition Debris Recovery Ordinance: Required builders to use registered haulers and recycling facilities for debris.
- 2006 – Food Service Foam Ban: Banned polystyrene takeout containers and required compostable or recyclable alternatives. San Francisco was the first U.S. city to do so.
- 2007 – Plastic Bag Reduction Ordinance: First citywide plastic bag ban in the country, requiring supermarkets and pharmacies to switch to compostable or recyclable bags, or charge for reusable ones.
- 2009 – Mandatory Recycling and Composting Ordinance: Required all residents and businesses to separate recyclables, compostables, and trash. Fines could be issued for non-compliance.
These policies had direct effects. By 2010, the city’s diversion rate had reached 77%. Compost collection increased by 45% following the 2009 ordinance, growing from 400 to 600 tons per day. By 2012, San Francisco announced it had reached 80% landfill diversion—the highest of any North American city. That year, the city had cut landfill disposal by half in a decade and exceeded its 75% goal ahead of schedule.
San Francisco became the first U.S. city with a citywide composting program (1996), the first to enact a plastic bag ban (2007), and the first to pass a mandatory recycling and composting law (2009). These initiatives brought the city from a 27% diversion rate in 1990 to about 80% by the early 2010s.
|
Year |
Milestone |
| Early 1900s | Immigrant workers salvaged materials from trash—early recycling practice |
| 1921 | City formalizes waste collection under two licensed companies |
| 1970s | Volunteer recycling centers begin operating |
| 1980 | San Francisco Recycling Program launched |
| Early 1980s | First curbside recycling pilot introduced |
| 1986 | California Bottle Bill (AB 2020) offers cash refunds for containers |
| 1988 | City targets 32% diversion by 1992 |
| 1989 | State law AB 939 mandates 25% diversion by 1995, 50% by 2000 |
| 1990 | San Francisco reaches 27% diversion |
| 1991 | Full curbside recycling program operational |
| 1996 | Composting pilot begins—first large-scale program in U.S. |
| 1999 | “Fantastic Three” bin system introduced |
| 2000 | Composting expands citywide; 50% diversion goal met |
| 2002 | Zero Waste Goal adopted (75% by 2010, zero waste by 2020) |
| 2004 | Green Building Ordinance passed |
| 2006 | Construction & Demolition Debris Recovery Ordinance passed |
| 2006 | Polystyrene takeout containers banned |
| 2007 | First citywide plastic bag ban in the U.S. |
| 2009 | Mandatory Recycling and Composting Ordinance enacted |
| 2010 | Diversion rate reaches 77% |
| 2012 | City announces 80% diversion rate, highest in North America |
Current Waste Management Programs in San Francisco
San Francisco continues to run mandatory recycling and composting programs under its updated Zero Waste framework. While the city did not eliminate waste by 2020, it set new targets in 2018: reduce total solid waste generation 15% from 2015 levels and cut landfill or incineration disposal 50% by 2030.
Citywide Three-Bin Collection
Every property in San Francisco uses the standardized three-bin system—blue for recyclables, green for compost, and black for landfill. The program accepts a broad range of materials: all paper, cardboard, glass, metal, and plastics labeled #1 through #7 go in the blue bin; all food scraps, yard waste, and soiled paper go in the green bin. The law requires property owners to subscribe to composting and recycling services, and Recology reports tonnage from each stream to city authorities.
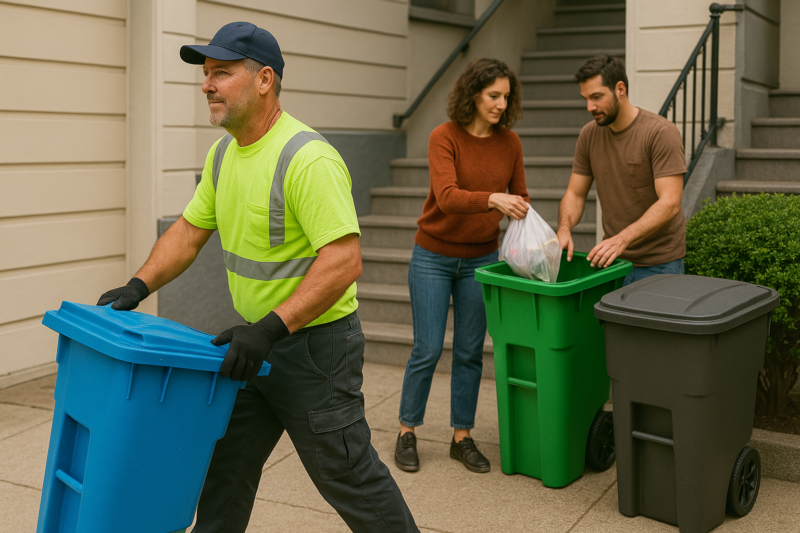
Compliance and Outreach
The city enforces its Mandatory Recycling and Composting Ordinance through a system of warnings and site inspections. Containers can be checked for improper sorting. While fines are legally allowed, enforcement is centered on education. Recology staff provide multilingual training, distribute compost pails for kitchens, and offer on-site support for apartment buildings and businesses. The result: high participation rates across sectors. Many restaurants report diverting over 90% of their waste.
Organics Composting
San Francisco collects more than 500 tons of organic material per day through the green bin program. All collected organics are processed at Blossom Valley Organics, where they are turned into compost in about two months. This compost is then used by farms, vineyards, and gardeners in the region. Recology has expanded processing capacity to over 1,000 tons per day to meet increasing volumes.
Source Reduction Policies
San Francisco has implemented several ordinances to reduce waste before it starts, with a focus on single-use plastics:
- 2007–2012: The Checkout Bag Ordinance expanded from supermarkets to all retailers and added fees to reduce plastic bag usage.
- 2016: Polystyrene foam banned across most products, including packaging and containers.
- 2019: Plastic, Litter, and Toxics Reduction Law restricted the distribution of plastic straws, utensils, and lids, and prohibited certain purchases by city agencies, such as bottled water.
These measures supplement statewide mandates like California’s SB 1383, which requires organics collection across the state.
Hard-to-Recycle Items and Producer Responsibility
San Francisco supports end-of-life collection for items not suited for curbside bins. The city facilitates drop-off events for electronics, hazardous waste, large items, and textiles. It also backs laws requiring manufacturers to cover disposal costs for items like paint, mattresses, and medications.
The city’s Department of the Environment continues testing new strategies—from zero-waste event requirements to repair incentives—to reduce waste generation and improve recovery.
Technology and Infrastructure Supporting San Francisco’s Waste Diversion
San Francisco’s recycling efficiency is built on more than household sorting—it depends heavily on modern processing infrastructure and continuous investment in waste management technology.
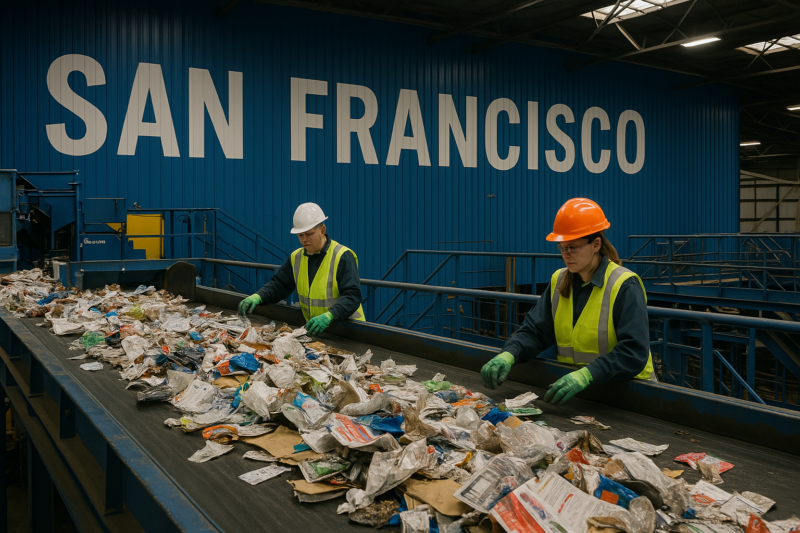
Recycling Sorting Facility: Recycle Central at Pier 96
Recology operates the city’s primary materials recovery facility at Pier 96. The 200,000-square-foot site processes all blue-bin recyclables. Since its last major upgrade in 2019, the facility uses seven optical sorters, including Pellenc ST units with infrared and artificial intelligence to identify different plastics and paper grades. These are supported by rotating screens, steel magnets, eddy currents for aluminum, air classifiers, and AI-powered robotic arms that remove contaminants from the sorting line.
The facility targets contamination rates of around 1% in outbound material—a benchmark few U.S. cities have achieved.
Single-Stream Recycling
San Francisco has used a single-stream recycling system since the late 1990s. All recyclables go into the blue bin without the need for sorting by type. Participation is easier for residents, and the material is separated at the facility using high-speed sortation technology. The city’s investment in automated sorting equipment offsets the additional processing this method requires.
Composting Infrastructure
Collected organics are trucked to commercial composting facilities outside the city. Material is shredded, formed into windrows, aerated, and monitored for heat and moisture over roughly two months. The final product is tested for safety and quality, and meets standards for use in organic agriculture. Local farms and vineyards buy this compost, closing the loop between consumption and food production.
Collection Technology
Recology’s fleet includes split-body and dedicated trucks to separately collect recyclables, compostables, and trash. Routes are optimized using logistics software. Most trucks run on biodiesel or natural gas. Each bin is equipped with an RFID tag and is weighed at collection to capture volume data. This system allows tracking of diversion rates and identification of high-contamination generators.
Monitoring and Data Systems
Both Recology and the city use real-time data to monitor recycling and composting activity. Tonnage is reported by material type. When trends show stagnation in specific streams, the city uses this data to adjust education or enforcement strategies. San Francisco also conducts regular waste characterization studies, a practice it began in the 1990s, to assess material types that continue to end up in landfill bins.
Innovation Pilots
The city continues to test new technologies. Pilot projects have included sensor-enabled bins that indicate when they need servicing and small-scale anaerobic digesters for generating biogas from food scraps. Recology’s in-house team evaluates new sorting tools to address materials that are currently hard to recycle, including items like multilayer plastics.
When international markets tightened contamination standards, San Francisco responded by upgrading equipment and improving public outreach rather than scaling back recycling efforts.
Technology integration—from collection and sorting to composting and monitoring—allows San Francisco to maintain a high diversion rate and adapt to changing material streams and regulations.
Outcomes and Performance of San Francisco’s Zero Waste Program

San Francisco has maintained some of the highest landfill diversion rates among major cities, supported by data across multiple performance categories.
Landfill Diversion Rate
The city diverts approximately 80% of its municipal solid waste through recycling and composting. It surpassed its 75% target ahead of the 2010 goal, reaching about 78% by 2011 and 80% by 2012. This rate has remained stable in the high 70s to 80% range. The national average in the United States is around 35%, while California’s state average has been about 42% in recent years.
This translates into over 1.5 million tons of material recycled or composted annually, rather than sent to landfill.
Landfilled Waste Volume and Per-Capita Disposal
Annual landfill tonnage has dropped significantly. In 2000, San Francisco landfilled approximately 476,000 tons. By 2010, that figure had fallen to around 307,000 tons. In the mid-2010s, the city stabilized at approximately 0.8 to 0.9 million pounds of landfilled waste per day, for a population close to 875,000.
The per-capita landfill disposal rate was 3.7 pounds per person per day in 2015—one of the lowest among major U.S. cities and well below California’s goal of 5.3 pounds. The national average in 2018 was about 4.9 pounds per person per day, including recyclable material. San Francisco’s numbers reflect a sustained reduction in individual waste disposal.
Total Waste Generation Trends
Despite population and economic growth during the 2010s, San Francisco’s total waste generation (landfill, recycling, and compost combined) remained flat or declined in certain years. From 2000 to 2015, total solid waste generation per capita fell by about 20%. This reduction points to the impact of prevention-focused policies like bag bans and packaging limits.
Climate and Environmental Impact
San Francisco’s composting program reduces methane emissions by diverting organic waste from landfills. Recycling conserves materials and energy; for example, recycling aluminum saves up to 95% of the energy required to produce it from raw ore.
The city includes waste-related emissions reductions in its Climate Action Plan, contributing to citywide greenhouse gas cuts. Avoided emissions from both landfilling and manufacturing are equivalent to removing thousands of vehicles from the road each year.
Economic Effects
Recycling and composting have also supported employment. Converting 10,000 tons of waste to recycled material creates around 36 jobs, compared to 6 jobs for landfilling the same amount. Recology, the city’s waste services contractor, employs more than a thousand worker-owners.
Revenue from the sale of processed materials—such as compost sold to regional farms and bales of paper sold to mills—helps stabilize operational costs and supports program continuity.
San Francisco’s system has become a reference point for cities globally. Over 135 countries have sent delegations to study its model. These results underscore how structured policies, consistent monitoring, and infrastructure investment can deliver measurable outcomes in urban waste management. Here’s a revised title and description in line with your style:
San Francisco Waste Management Metrics
The table below outlines key figures from San Francisco’s waste management program, based on available data and rounded city estimates.
| Metric (Year) | San Francisco (City & County) |
| Population (2020) | 873,965 residents |
| Waste Diversion Rate (2012–2020) | ~80% of municipal solid waste diverted from landfill |
| Landfill Disposal Rate (2015) | 3.7 lbs landfilled per person per day |
| Annual MSW Landfilled (2019 est.) | ~300,000 tons (down from ~600,000 tons in 2000) |
| Annual Material Composted | ~200,000 tons (approx. 550–600 tons per day) |
| Annual Material Recycled | ~1,300,000+ tons (estimated from 80% diversion rate) |
Note: MSW = municipal solid waste. Diversion includes combined recycling and composting. Tonnage estimates are based on city-reported totals and rounded figures derived from an ~80% diversion of approximately 1.6 million tons of total waste annually.
Comparison: San Francisco and Seattle Waste Management Programs
Seattle and San Francisco are two of the few large U.S. cities that have implemented citywide recycling and composting requirements. While they share similar goals, each city has followed its own timeline and strategy.
Program Timelines and Goals
Seattle rolled out curbside recycling in the late 1980s, slightly ahead of San Francisco’s citywide rollout by 1990. Both cities adopted “pay-as-you-throw” pricing models, charging residents based on the volume of trash to encourage waste reduction. San Francisco passed its Zero Waste resolution in 2002, targeting 75% diversion by 2010 and zero waste by 2020. Seattle followed with a Zero Waste resolution in 2007 and a detailed solid waste plan in 2013 that aimed for 70% recycling by 2022.
Mandatory Recycling and Composting Laws
San Francisco enacted a citywide mandatory recycling and composting law in 2009, covering all sectors at once and including enforcement provisions. Seattle took a phased approach. It began requiring commercial recycling in 2003, banned recyclables like cardboard from trash in 2005, and mandated composting of food waste citywide by 2015. While both cities issue warnings for non-compliance, San Francisco enforces its ordinance more comprehensively through a single legal framework.
Collection and Service Providers
Both cities use a three-bin collection system—blue for recyclables, green for organics, and black or gray for landfill. San Francisco rolled out its “Fantastic Three” system citywide by 2000. Seattle’s composting of food scraps began as voluntary in the mid-2000s and became mandatory in 2015. San Francisco contracts all collection and processing to Recology under an exclusive agreement. Seattle splits collection between Waste Management and Recology CleanScapes, based on service zones, and owns its transfer stations.
Source Reduction Policies
San Francisco banned plastic bags in 2007, ahead of Seattle’s ban, which took effect in 2012. Both cities have banned polystyrene foam containers—San Francisco in 2006 and Seattle in 2009. Seattle was first to ban plastic straws and utensils in 2018; San Francisco implemented a similar rule in 2019. Both cities require compostable or recyclable food containers for takeout and have restricted city agencies from purchasing single-use plastics like bottled water.
Diversion and Performance Metrics
San Francisco reports a waste diversion rate of around 80%, which includes recycling and composting. Seattle’s combined rate peaked near 59% in 2016 and was about 53% in 2021. Seattle does not include construction materials in this number, which could raise the overall diversion rate if counted. Seattle did not meet its 70% diversion target for 2022 and has since refocused on reducing total waste generation through its updated 2022 plan.
Per-Capita Disposal and Total Waste
In 2015, San Francisco landfilled approximately 3.7 pounds of waste per person per day. Seattle reported a lower landfill disposal rate—about 0.81 pounds per person per day in 2017—based on its methodology. Both cities report lower disposal rates than the national average. In 2021, Seattle generated about 735,000 tons of total municipal waste. San Francisco generated roughly 800,000 tons in 2018, but due to higher diversion, landfilled fewer tons than Seattle despite a larger population.
Side-by-Side Summary
San Francisco leads in diversion percentage and has implemented stricter enforcement. Seattle has made measurable progress in waste prevention and has adopted many similar policies, often within a few years of San Francisco. Both cities have set high diversion goals and continue to adjust strategy based on program performance.
| Aspect / Metric | San Francisco (CA) | Seattle (WA) |
| City Population (2020 census) | 873,965 | 737,015 |
| Waste Diversion Rate (latest) | ~80% of municipal solid waste diverted (recycled + composted) | ~53% diversion in 2021 (peak ~59%) |
| Per Capita Landfill Disposal | 3.7 lbs/person/day (2015) | 0.81 lbs/person/day (2017) |
| Year Residential Composting Began | 1996 pilot; citywide by 2000 | 2005 pilot; voluntary by 2009, mandatory by 2015 |
| Mandatory Recycling Law | Yes – 2009 (all sectors) | Yes – phased in: commercial 2003; food waste ban in 2015 |
| Plastic Bag Ban | Yes – 2007 (expanded 2012) | Yes – effective 2012; superseded by state law in 2021 |
| Foam Food Container Ban | Yes – 2006 | Yes – 2009 |
| Latest Zero Waste Goal | Updated target: 15% less waste than 2015 and under 50% disposal by 2030 | Targeted 70% by 2022; now focusing on waste prevention |
Sources: City ordinances, EPA case studies, annual reports
- San Francisco and Seattle both require recycling and composting citywide, supported by long-term policy and public engagement. San Francisco’s diversion rate is higher, largely due to earlier adoption of mandatory composting and a unified, citywide law that applies to all generators at once.
- Seattle has made steady gains—rising from 26.8% diversion in 1998 to 56.9% in 2017—but has not reached its 70% target. The slowdown in recent years reflects the difficulty of moving beyond initial material types (like yard waste and basic recyclables) toward capturing more complex waste streams.
- Seattle’s long-distance landfill transport—about 260 miles to Oregon—has made recycling financially favorable, helping justify investment. The city estimates that recycling costs about 50% less per ton than landfilling due to avoided transportation expenses.
- Operational models differ: San Francisco relies on a single provider, Recology, under an exclusive, no-bid franchise agreement. This structure allows faster program changes. Seattle uses competitively bid contracts split by service zones. While this creates oversight and pricing transparency, it has also required more negotiation to expand services.
- In both cities, the cost of waste services remains in line with or below national urban averages. Both report high community participation. San Francisco had about 85% public support for its 2009 recycling ordinance. Seattle residents similarly value environmental efforts and regularly engage in education programs. Multilingual outreach is a standard feature of San Francisco’s strategy, while Seattle runs its education through Seattle Public Utilities, including school-based initiatives.
- Both cities have responded to changing international recycling markets by adjusting collection practices and contamination standards. Each continues to update accepted materials and adapt to restrictions like China’s 2018 import bans.
- San Francisco has achieved higher diversion with earlier, more centralized enforcement and infrastructure. Seattle has implemented nearly all the same measures, albeit on a slightly delayed timeline. Both cities have proven that landfill dependence can be reduced in major urban settings through coordinated policy, infrastructure, and community engagement.
Conclusion
San Francisco’s recycling success is the result of decades of policy, infrastructure, and public participation. Milestones like reaching 50% diversion by 2000 and 80% by 2012 were driven by mandatory laws, early composting programs, and consistent investment. The city’s partnership with Recology, education efforts, and data-driven enforcement have sustained high performance. While the last portion of waste remains difficult to eliminate, San Francisco continues to pursue new technologies and policies. Its model shows that large cities can dramatically cut landfill use with clear rules, strong systems, and public engagement—offering a practical reference point for others aiming to reduce waste.


