Property Taxes by State in 2025 + Historical Data
In 2024, property taxes have changed across the nation. King County, WA, saw tax increases due to voter-approved measures for community services. Nebraska and Wyoming are seeking relief, with Nebraska’s plan to cut property taxes falling short and Wyoming offering exemptions. Indiana and Colorado have different strategies, with Indiana moderating increases and Colorado reducing valuations. Nationally, property taxes for single-family homes rose by 4.1% in 2023. Disparities persist, with Northeast states having higher taxes than the Midwest and South.
Property Taxes by State (2020 – 2024)
| State | 2020 | 2021 | 2022 | 2023 | 2024 |
| Alabama | 0.40% | 0.40% | 0.40% | 0.40% | 0.41% |
| Alaska | 1.19% | 1.19% | 1.19% | 1.24% | 1.24% |
| Arizona | 0.60% | 0.60% | 0.60% | 0.60% | 0.60% |
| Arkansas | 0.61% | 0.61% | 0.61% | 0.61% | 0.66% |
| California | 0.70% | 0.70% | 0.70% | 0.70% | 0.81% |
| Colorado | 0.48% | 0.48% | 0.48% | 0.48% | 0.52% |
| Connecticut | 2.14% | 2.14% | 2.14% | 2.16% | 2.16% |
| Delaware | 0.43% | 0.43% | 0.43% | 0.43% | 0.62% |
| Florida | 0.89% | 0.89% | 0.89% | 0.89% | 0.89% |
| Georgia | 0.95% | 0.95% | 0.95% | 0.95% | 0.95% |
| Hawaii | 0.27% | 0.27% | 0.27% | 0.27% | 0.29% |
| Idaho | 0.63% | 0.63% | 0.63% | 0.63% | 0.63% |
| Illinois | 2.05% | 2.05% | 2.05% | 2.29% | 2.29% |
| Indiana | 0.83% | 0.83% | 0.83% | 0.83% | 0.83% |
| Iowa | 1.53% | 1.53% | 1.53% | 1.59% | 1.59% |
| Kansas | 1.28% | 1.28% | 1.28% | 1.40% | 1.40% |
| Kentucky | 0.83% | 0.83% | 0.83% | 0.89% | 0.89% |
| Louisiana | 0.56% | 0.56% | 0.56% | 0.56% | 0.62% |
| Maine | 1.20% | 1.20% | 1.20% | 1.29% | 1.29% |
| Maryland | 1.07% | 1.07% | 1.07% | 1.07% | 1.07% |
| Massachusetts | 1.19% | 1.19% | 1.19% | 1.19% | 1.19% |
| Michigan | 1.45% | 1.45% | 1.45% | 1.53% | 1.53% |
| Minnesota | 1.10% | 1.10% | 1.10% | 1.10% | 1.10% |
| Mississippi | 0.81% | 0.81% | 0.81% | 0.81% | 0.81% |
| Missouri | 1.00% | 1.00% | 1.00% | 1.00% | 1.00% |
| Montana | 0.83% | 0.83% | 0.83% | 0.83% | 0.83% |
| Nebraska | 1.54% | 1.54% | 1.54% | 1.70% | 1.70% |
| Nevada | 0.55% | 0.55% | 0.55% | 0.55% | 0.55% |
| New Hampshire | 1.89% | 1.89% | 1.89% | 2.09% | 2.09% |
| New Jersey | 2.13% | 2.13% | 2.13% | 2.46% | 2.46% |
| New Mexico | 0.59% | 0.59% | 0.59% | 0.59% | 0.84% |
| New York | 1.30% | 1.30% | 1.30% | 1.73% | 1.73% |
| North Carolina | 0.80% | 0.80% | 0.80% | 0.80% | 0.80% |
| North Dakota | 1.02% | 1.02% | 1.02% | 1.02% | 1.02% |
| Ohio | 1.52% | 1.52% | 1.52% | 1.57% | 1.57% |
| Oklahoma | 0.99% | 0.99% | 0.99% | 0.99% | 0.99% |
| Oregon | 0.92% | 0.92% | 0.92% | 0.92% | 0.92% |
| Pennsylvania | 1.43% | 1.43% | 1.43% | 1.56% | 1.56% |
| Rhode Island | 1.37% | 1.37% | 1.37% | 1.54% | 1.54% |
| South Carolina | 0.56% | 0.56% | 0.56% | 0.56% | 0.58% |
| South Dakota | 1.14% | 1.14% | 1.14% | 1.24% | 1.24% |
| Tennessee | 0.61% | 0.61% | 0.61% | 0.61% | 0.65% |
| Texas | 1.60% | 1.60% | 1.60% | 1.90% | 1.90% |
| Utah | 0.56% | 0.56% | 0.56% | 0.56% | 0.57% |
| Vermont | 1.76% | 1.76% | 1.76% | 1.89% | 1.89% |
| Virginia | 0.83% | 0.83% | 0.83% | 0.83% | 0.83% |
| Washington | 0.93% | 0.93% | 0.93% | 0.93% | 0.93% |
| West Virginia | 0.53% | 0.53% | 0.53% | 0.53% | 0.59% |
| Wisconsin | 1.53% | 1.53% | 1.53% | 1.71% | 1.71% |
| Wyoming | 0.51% | 0.51% | 0.51% | 0.51% | 0.61% |
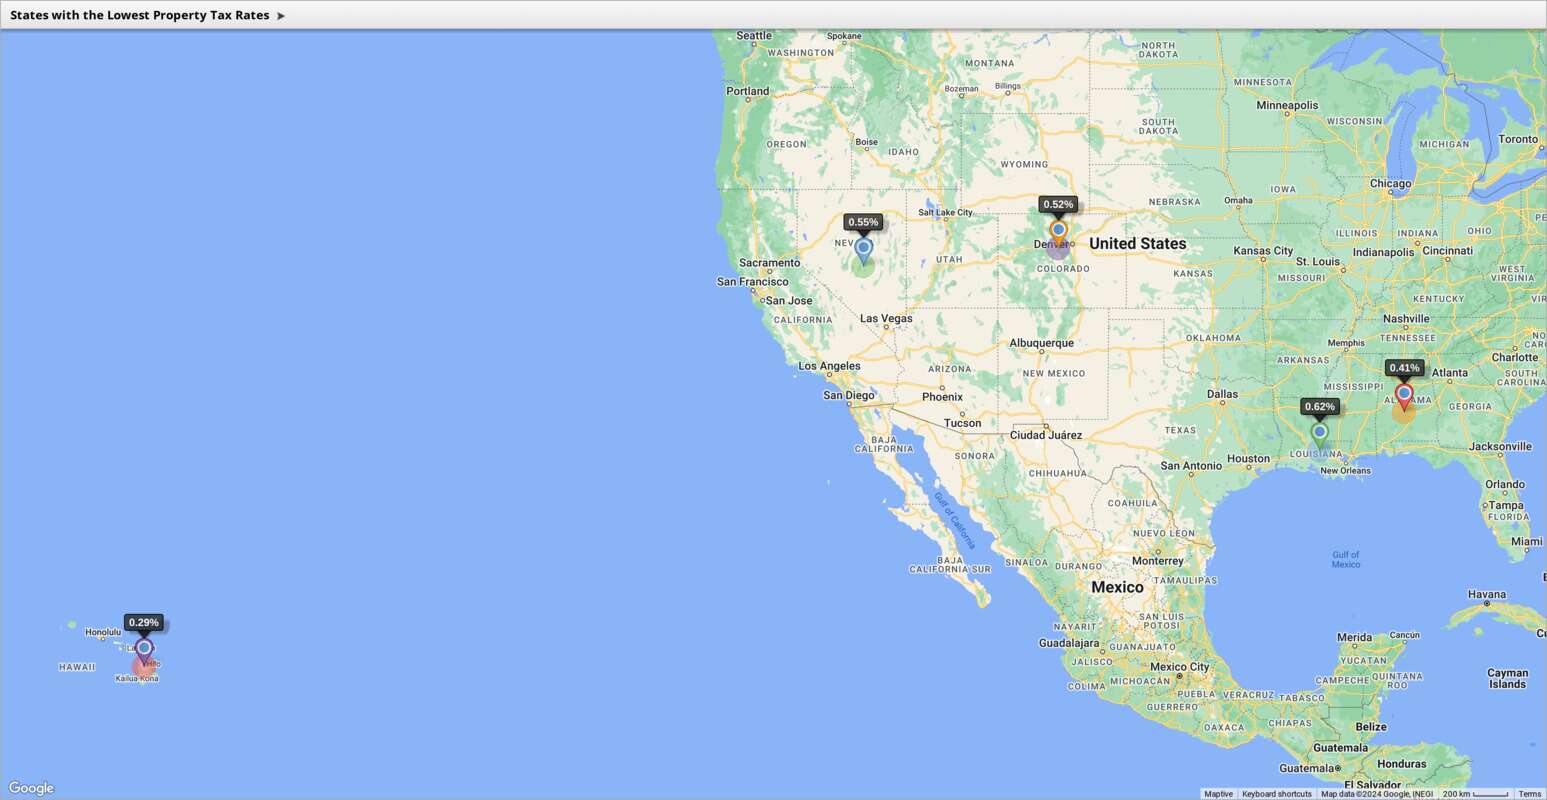
States with the Lowest Property Tax Rates
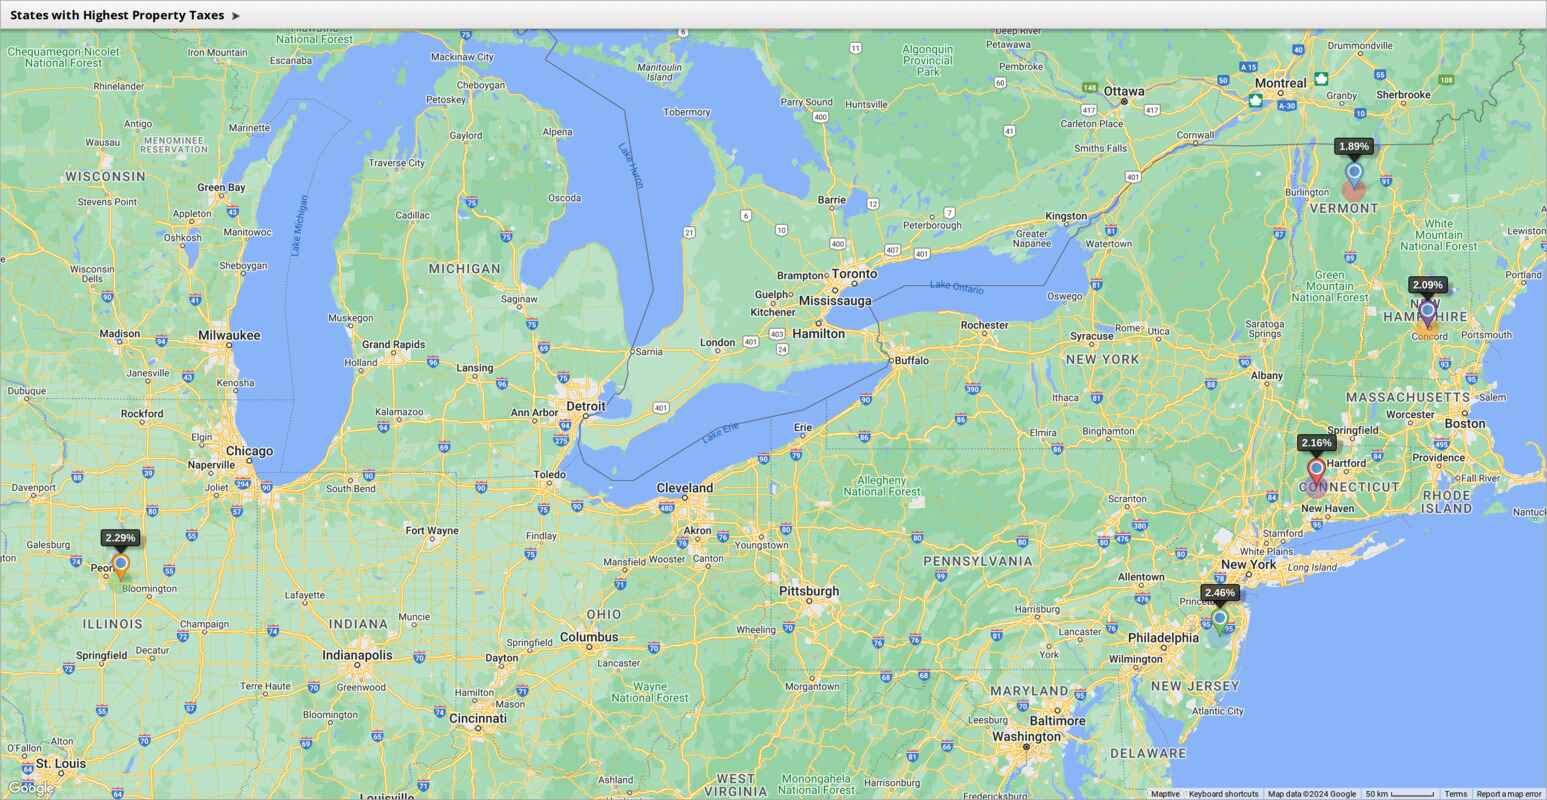
States with the Highest Property Tax Rates
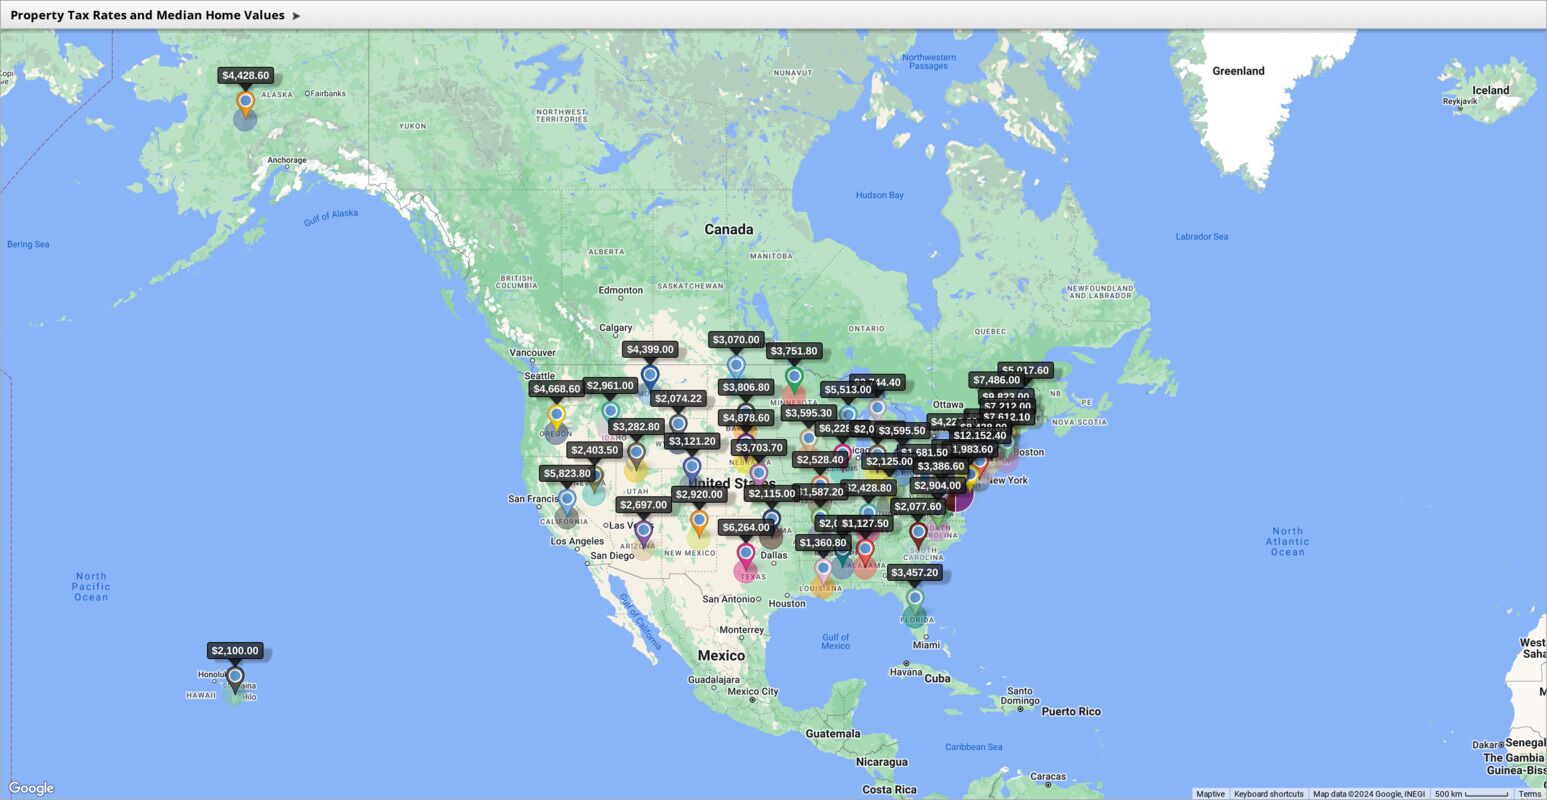
Property Tax Expense Based on Median Home Values
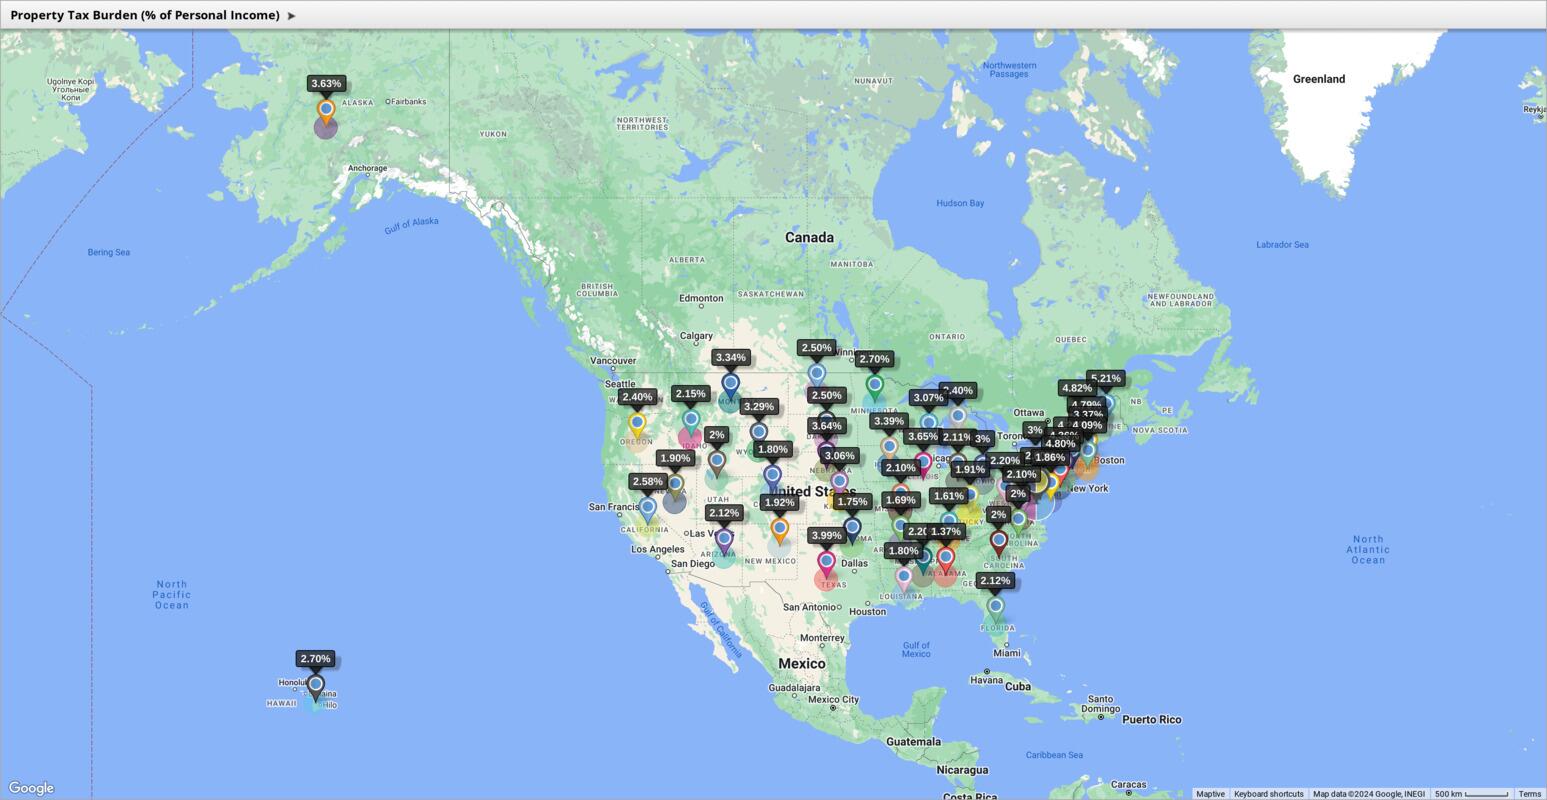
Property Tax Burden (% of Personal Income)
Start mapping now!
Just follow these simple steps:
Copy & Paste OR Drag & Drop Your Data Set Here.
OR you can Upload your file
 Important: Remember to include column headers in your data set. (like the example)
 Date Security: Your data is transferred using encrypted https
What is Property Tax?
Property taxes in the United States are local taxes levied on property owners by various jurisdictions, including counties, cities, school districts, and special districts. These taxes are a major source of revenue for local governments, and a significant portion of them supports public schools, covering teacher salaries, school facilities, and educational programs.
Property taxes are also used to finance local police and fire departments and to maintain and improve infrastructure, such as roads, bridges, and public transportation systems, which are crucial for economic activity and commuter safety. Depending on the area, taxes could also be used to fund parks, recreational facilities, libraries, and other public amenities–or to support social services, such as housing assistance, food security initiatives, and services for seniors and individuals with disabilities.
So altough few look forward to paying taxes, it’s important to remember that they play a critical role in maintaining and improving the standard of living across the United States.
How Are Property Taxes Calculated?
Assessment of Property Value
Property taxes are based on the assessed value of a property, determined by local tax assessors. Typically, the assessed value is a percentage of the property’s fair market value.
Assessors often use various methods to determine property value, depending on what information might be more recent and available. For example, the comparable sales method involves comparing the property that is being appraised to similar properties that have recently sold. The depreciated cost method, on the other hand, calculates the cost to replace the property minus depreciation–while the income method evaluates a property’s ability to generate income.
Cadastral maps are often used to aid in the assessment process to avoid any doubts arising about property lines or land ownership. Cadastral maps visualize all those details, facilitating real estate transactions and helping tax assessors find the answers they need.
Assessment of Property Value
The millage rate is essentially a property tax levied per $1,000 of a property’s assessed value. This rate is used to calculate the property tax owed. For instance, a millage rate of 20 means $20 in tax for every $1,000 of assessed property value.
Property owners usually pay taxes to multiple government entities like counties, cities, and school districts–depending on the area where their property is located. Each of these entities sets its own millage rate. Therefore, the total property tax is a sum of taxes imposed by all applicable jurisdictions.
Several factors influence millage rates, including the level of government spending, fluctuations in property values, overall economic conditions, and the existence of property tax exemptions or abatements. It’s crucial to remember that the assessed value might differ from the property’s market value. Property owners can sometimes appeal their assessed value or benefit from property tax caps.
Calculation of Property Tax
Property tax is determined by multiplying a property’s assessed value by the applicable tax rate. The assessed value is an estimation of the property’s worth for tax purposes, which may differ from its market value. The tax rate is expressed as a percentage.
For instance, if a home is assessed at $400,000 and the local tax rate is 2%, the annual property tax would amount to $8,000 ($400,000 multiplied by 0.02). However, you should always keep in mind that properties might be subject to taxes from multiple government entities, each with its own tax rate, which would contribute to the overall tax burden.
Payment and Collection
Property tax bills are typically issued annually, but the exact timing and frequency of payments can vary depending on local regulations.
Whatever the payment schedule, it’s important to stick to it, as property tax delinquency can lead to unpleasant consequences, including penalties and interest charges. In severe cases of non-payment, a government entity can even place a lien on the property, which can complicate property ownership and sales.
Variations in Property Taxes
By State and Locality
Property tax rates and assessed values vary across states and localities. For example, New Jersey has one of the highest effective property tax rates at 2.23%, while Hawaii has one of the lowest at 0.32%.
The average property tax bill also varies greatly, with some counties having median property taxes over $10,000 annually.
Exemptions and Reductions
Property tax exemptions and reductions can significantly alleviate the financial burden for specific groups of homeowners. These programs are designed to offer tax relief based on particular circumstances.
For instance, homestead exemptions often provide a tax break for properties that are the primary residence of the owner. Senior citizen exemptions offer tax reductions for homeowners who meet specific age and income criteria. Additionally, veterans and disabled homeowners may qualify for exemptions based on their service or disability status.
Impact and Importance
Revenue for Local Services
Property taxes serve as a primary funding source for essential local services, supporting a wide range of public functions, including education, public safety (police and fire departments), infrastructure maintenance (roads, bridges), and utilities.
In fiscal year 2020, property taxes accounted for a substantial 32.2% of total state and local tax revenue across the United States–meaning property taxes constitute roughly ⅓ of the funding used by local governments in delivering of essential public services.
Economic Considerations
Property taxes are often criticized for being regressive, meaning they can have a disproportionately larger impact on lower-income homeowners compared to higher-income ones. This is because the tax is based on property value rather than income.
However, property taxes offer a stable and consistent revenue stream for local governments, which is essential for funding essential public services such as education, public safety, and infrastructure.
Recent Trends in Property Taxes
2024 has been a landmark year for the number of changes that have been made to property taxes across the nation. From coast to coast, homeowners and policymakers alike are grappling with rising costs, new tax measures, and the ongoing debate about the fairness and effectiveness of this fundamental source of local revenue.
In the Pacific Northwest, King County, WA, offers a prime example of upward pressure on property taxes, though the substantial increase was primarily driven by voter-approved measures aimed at funding behavioral health services, veterans’ programs, and public safety initiatives. This trend of using property taxes to address specific community needs is mirrored in many cities and fire districts across the county.
Meanwhile, states like Nebraska and Wyoming are actively seeking ways to alleviate the property tax burden. Nebraska’s ambitious plan to cut property taxes by 40% through a sales tax increase ultimately fell short, highlighting the complexities of tax reform. Wyoming, on the other hand, has taken more targeted steps, such as offering exemptions for long-term homeowners and capping annual tax increases.
Indiana and Colorado represent yet different approaches to property tax management. Indiana has focused on moderating increases for homeowners, mostly through a temporary increase in the homestead supplemental deduction which reduced the growth of net assessed value for homesteads by 8-10%. Colorado, on the other hand, has opted for a direct reduction in property valuations, though ultimately the state will have to reimburse counties directly for the reduction in property tax revenue resulting from these measures. These varying strategies underscore the diverse landscape of property taxation across the country.
Nationally, the average property tax bill for single-family homes is on the rise, having increased by 4.1% in 2023–driven in part by increasing home values. Overall, from 2019 to 2023, the median property tax bill for single-family homes in the U.S. climbed by around 24%, a trend that is particularly challenging for new homeowners, many of whom are caught off guard by unexpected tax assessments.
This is especially true for brand new homes since they are typically reassessed and property taxes can increase significantly from the estimated amount initially set aside in escrow. A 2023 survey found that over a third of new homeowners were surprised by their property tax bills, highlighting this as a common challenge. This mismatch between estimated and actual property taxes can lead to financial strain and higher overall housing costs.
The matter is not helped by the wide discrepancies in property taxes across the U.S. In fact, if you calculate it at the national level, homeowners typically pay about 1% of their home’s value in property taxes each year–but states in the Northeast, like New York and New Jersey, have much higher property taxes compared to states in the Midwest and South.
From voter-approved tax hikes to legislative attempts at relief, the property tax landscape in the United States is in a state of flux. As homeowners and policymakers navigate this complex terrain, finding a balance between funding essential services and mitigating the financial impact on taxpayers will continue to be a top priority.


