Choosing the right store location remains crucial for retailers, now more than ever. In fact, despite the growth of e-commerce, brick-and-mortar stores still account for 85% of retail sales in the United States in 2024.
Effective site selection involves analyzing demographics, traffic patterns, competition, and economic factors to maximize a store’s visibility, accessibility, and profitability. As retailers adapt to changing consumer behaviors and market conditions, strategic site selection remains a cornerstone strategy for driving growth and maintaining competitiveness in the retail industry.
Table of Contents

Choosing the right location for retail stores starts with understanding who your customers are.
Demographics—things like age, income, gender, education level, and lifestyle preferences–help retailers figure out where their target market is and how they shop. For example, different age groups have different shopping habits, from teens to seniors.
Depending on your business, understanding your customers from a demographic perspective might also involve looking at regional differences and urban versus rural settings through geographic segmentation. Or, you might opt for psychographic segmentation to dive into the lifestyles and values of your consumers, like whether they’re eco-conscious or tech-savvy.
All of the above can help you better understand their shopping behaviors, such as brand loyalty and price sensitivity, factors that can help you tailor your marketing and sales strategies.
A good example of how that information can shape business strategy and make your retail business even more successful is the case of To’ak Chocolate, which boosted sales dramatically by sending exclusive offers to their frequent buyers through automated emails.
Considering local economic factors—also part of demographic data like employment rates and population growth—can help retailers predict future sales potential as well.
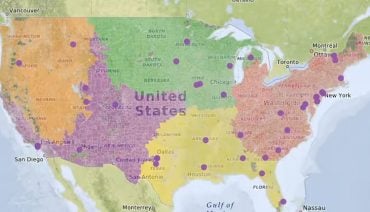
With almost 80% of retail transactions still happening in physical stores as of 2024, choosing the right location becomes even more critical. So, it’s no surprise that big players like Amazon are using physical stores as places for customers to pick up online orders, enhancing the overall shopping experience.Geographic Information Systems (GIS) and predictive analytics tools allow businesses to map out demographic data, analyze competitor locations, and study traffic patterns. For example, Maptive’s GIS mapping software transforms business location data into actionable visualizations, aiding in the identification of optimal sites based on demographic profiles, competitor landscapes, and accessibility.
Ideally, stores should be easy for customers to reach by foot, car, or public transport, with convenient parking. Areas with high foot traffic, like shopping centers or busy streets, naturally attract more potential customers.
A study by Platte River Analytics emphasizes the importance of factors like drive-time analysis and available parking in assessing site accessibility.
Understanding foot traffic patterns is essential for optimizing store operations. Locations with consistent foot traffic make it much easier for your retail shop to be easily visible and accessible.
Technologies such as geospatial analysis and Wi-Fi tracking can provide detailed insights into foot traffic trends. When combined with sophisticated tools like Big Data and Machine Learning, mobility data can yield some amazing insights. For example, in this case study by PREDIK Data-Driven, they used advanced technologies to evaluate potential retail locations in Jacksonville, FL, considering visitation rates and customer demographics.
Those same technologies can also help retailers find locations similar to their successful stores. They analyze foot traffic, customer visits, and behavior data to analyze not just visibility and accessibility but also to predict demand and market saturation. Advanced mapping tools can help visualize potential store catchment areas and traffic patterns, which is especially useful for high-end retailers looking to maximize their visibility.
Advanced models combining spatial accessibility and market potential assessment, as outlined in research in the International Journal of Geo-Information, can also help retailers make informed decisions based on socioeconomic data and consumer behavior insights.
Retailers need to consider existing businesses in the area—both complementary and competitive—to figure out where they can stand out and attract a loyal customer base.
Retailers should look at what other businesses are nearby, how well they’re doing, and whether the market is already saturated with offerings too similar to their own. This helps them find a unique place in the market where they can thrive.
Market saturation, on the other hand, is about figuring out if there are already too many stores offering the same products or services in an area. If that’s the case, it might be harder for a new store to stand out and attract customers. In rare cases, market saturation might instead be an advantage–if you think of the diamond district in New York, for example, it’s clear that any store trading precious stones would be at an advantage becoming part of such a well-known and highly specialized business community.
Real-world examples, like the redevelopment of the Westfield Mission Valley Mall in San Diego, show how strategic site selection can lead to successful projects that meet market demands. These projects often transform areas into mixed-use communities that cater to evolving consumer preferences.
When in doubt, testing the market with temporary arrangements like pop-up stores or short-term leases allows retailers to gauge customer interest and assess the potential profitability of a location before making a long-term commitment. This approach provides valuable real-world data and insights into how well a store might perform in a specific area.
Incorporating advanced spatial analytics and data science techniques further enhances the site selection process. By leveraging technologies like Maptive, that analyze geospatial data, human mobility patterns, and social media sentiment, retailers can make more accurate predictions about the success of a store in a particular location.
There are several critical cost factors that directly impact a new venture’s financial health and long-term success:
Due to spikes in material and labor prices in 2023, construction costs for retail spaces rose significantly, making it more challenging to justify new developments in some markets despite increasing rent prices. The national vacancy rate for retail spaces also saw a slight increase in early 2024, reflecting tighter market conditions and limited new retail projects despite higher average rent demands.
Real estate costs directly impact initial investments in land or building acquisition. While prime industrial areas may require more upfront investment, they often offer better infrastructure and logistical advantages that can balance out these higher setup costs over time.
Labor costs are another critical factor to consider. Regions with lower wages may struggle to find skilled labor, whereas areas with higher wages often see increased productivity and a more motivated workforce. This can be particularly beneficial for businesses that prioritize customer service.
Proximity to suppliers and markets is also essential for managing supply chain costs effectively. While choosing a location with lower costs initially may seem attractive, being far from suppliers can increase transportation expenses and create logistical hurdles.
Foot traffic data helps retailers predict how many potential customers will pass by their store and when. By studying foot traffic patterns, they can also see how well their competitors are doing and spot opportunities to attract more customers themselves through competitive pricing, unique offerings, or superior service.
Analyzing foot traffic data can also help you pinpoint areas that naturally attract more customers, ensuring your stores are prominently positioned and easily accessible.
Understanding peak traffic times enables retailers to plan everything from staffing to inventory management, giving them a shot at being more cost-efficient and improving their customer experience.
Foot traffic analysis can help in marketing, too. If you run a promotion and notice a corresponding higher foot traffic, you can directly measure ROI and refine future strategies accordingly. This data-driven approach mitigates risks associated with site selection by providing empirical data to support location decisions, helping retailers steer clear of areas with declining foot traffic and ensuring the new location has plenty of growth opportunities.
Other technologies, such as people-counting systems, provide real-time occupancy data to optimize store layouts and lighting strategies efficiently–and by focusing on creating more inviting store environments, retailers can further attract and retain customers.
As online shopping grows alongside physical retailers, shops can aso adopt hybrid approaches like digital catalogs and buy-online pick-up-in-store services–improving the customer experience and enhancing engagement.
Co-tenancy clauses protect tenants from the impact of neighboring businesses closing down. These clauses often include provisions that allow for rent reductions or lease terminations if anchor tenants leave or if overall occupancy drops below a specified level. For instance, when Sears stores became vacant, malls found innovative solutions like transforming them into movie theaters or mixed-use spaces to maintain their appeal.
Having strong co-tenants–like big-name retailers Macy’s, Nordstrom, Apple, and Sephora–can significantly boost a location’s attractiveness, as you are pretty much guaranteed consistent foot traffic. They function as anchors to the flow of customers through a shopping center but can also mean the disappearance of that precious foot traffic if they decide to move away, making co-tenancy clauses on your lease even more vital.
The mix of tenants within a shopping center or retail park is another critical factor. Businesses benefit from being near complementary stores like fitness centers or health food outlets, which can encourage customers to visit multiple shops during their visit.
To adapt to changing consumer needs and market trends, retailers are increasingly negotiating flexible lease agreements that allow for non-traditional uses like medical offices or entertainment venues. This flexibility in lease terms ensures that retail spaces remain dynamic and attractive in today’s competitive market environment.
Psychographic data dives deep into understanding consumer behaviors, motivations, and the reasons behind their decisions, covering a wide range of factors, like people’s values, interests, lifestyles, and psychological traits. For example, datasets such as The Data Group‘s US Consumer Psychographic Data and Factori People Data provide extensive records that help businesses understand what consumers want and how they think over many years.
Psychographic segmentation divides customers based on their psychological and lifestyle traits, helping businesses create marketing strategies and pick products that really connect with their customers, making them more likely to stick around and buy more.
In some cases, psychographics can also help shopping centers attract certain retailers to their business community. An example of this is Vestar Capital Partners, a private equity firm that boosted the appeal of a shopping center in Northern California by using data to attract a trendy brewery as a tenant.
Using psychographic data also helps retailers personalize their offerings. For example, if they find out that a lot of their customers are environmentally conscious, they might decide to stock more eco-friendly products or run campaigns that highlight their sustainability efforts. This kind of targeted approach helps build strong customer loyalty and sets businesses apart from their competitors.
Retailers carefully weigh the distance to suppliers and the quality of local logistics infrastructure to ensure goods can be delivered promptly and in a cost-effective way.
This is especially crucial today, where fast delivery and resilient supply chains are top priorities for businesses with an e-commerce presence. For instance, companies like Amazon emphasize locating near major transportation routes and distribution centers to achieve same-day delivery goals. This trend has spurred the development of new fulfillment centers in states like California and New Jersey, despite the higher costs and business challenges.
If you serve international markets, you will probably also need to weigh access to major U.S. deepwater ports. For example, container traffic has increased on the East Coast, benefitting from the expanded Panama Canal. This has led to the development of inland distribution centers near ports in cities such as Miami and Savannah, facilitating faster and more efficient last-mile delivery.
The costs of operating in different locations vary significantly based on proximity to major economic centers. Transportation costs, often several times higher than real estate expenses, can dictate where businesses locate their operations, as many now prioritize minimizing transportation expenses, even if it means higher upfront real estate costs.
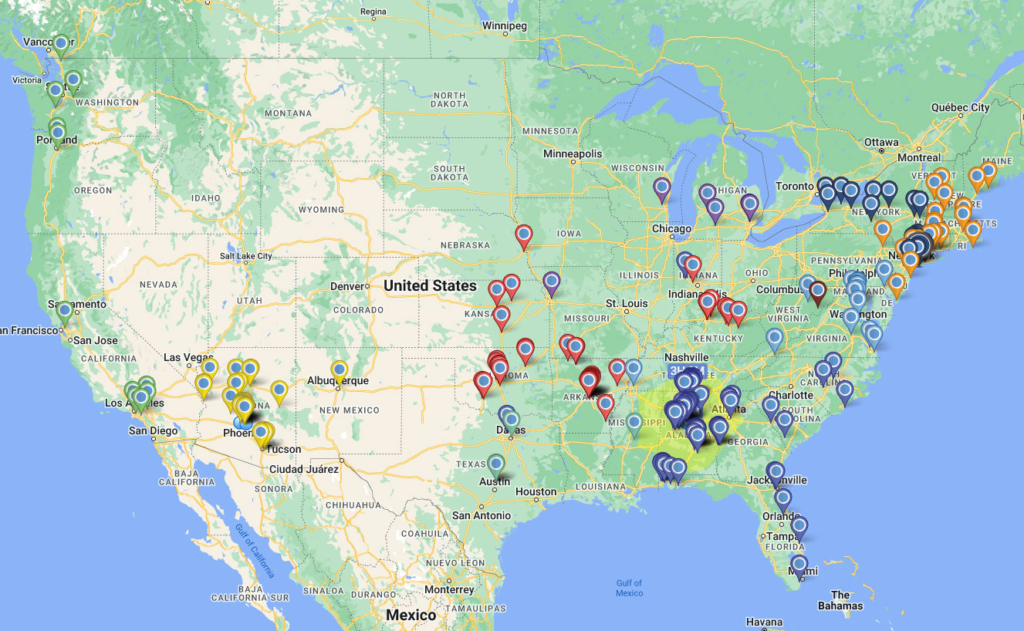
Areas with high population density are typically favored because they offer a steady flow of potential customers. For example, Wal-Mart strategically places its original discount stores in densely populated metropolitan areas across the Northeast, Midwest, and West regions of the United States. On the other hand, Supercenter stores are often located in less densely populated areas near major cities, reflecting a tailored approach based on population density and the type of store.
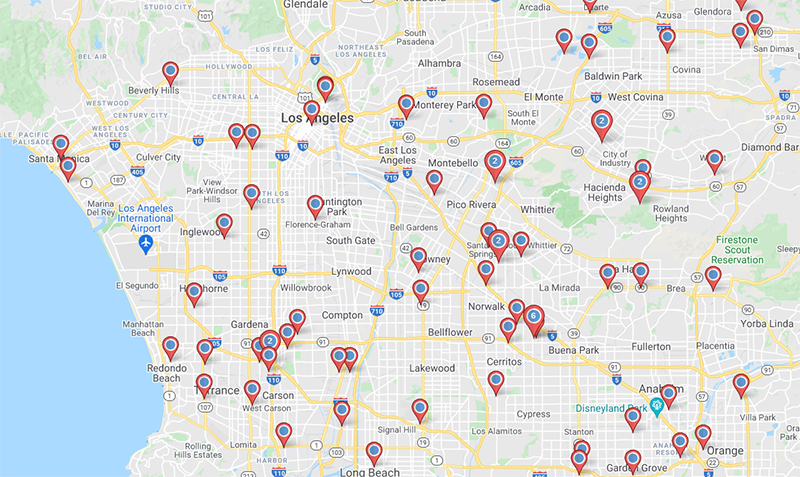
To decide on the best locations, retailers rely on data-driven methods like isochrone mapping, which helps visualize the catchment area by mapping driving radii from existing store locations. This method allows retailers to assess how many potential customers live within a specific geographic region. They combine this information with demographic data such as population density, age distribution, and nearby amenities to fine-tune their site selection process.
For example, a pharmacy chain might consider population density within a 10-minute radius, per capita income, and local infrastructure when selecting a new site to ensure its potential for success.
Moreover, population density data provides insights into local economic health and consumer behavior. By analyzing this data, retailers can predict long-term demand and ensure their stores are in economically viable areas.
Car traffic counts provide essential insights into how many vehicles and pedestrians pass by a location. This information directly impacts how many potential customers might visit a store, making locations with high traffic counts particularly appealing.
For example, StreetLight Advanced Traffic Counts offers detailed metrics on vehicle and pedestrian activity across millions of road segments in the U.S. and Canada. This data helps businesses pinpoint promising store locations based on traffic patterns and the area’s demographics.
By analyzing traffic data by time and day of the week, retailers can better understand when customer demand is highest, allowing them to adjust store hours, staffing, and other factors accordingly. For instance, areas with high car traffic might benefit from designated parking spots to make it easier for customers to access the store.
Locations with significant traffic flow are attractive to quality retail tenants, which is important for property brokers looking to attract businesses to specific locations. But it’s really a win-win situation for both sides, as high traffic counts indicate potential profitability for retail and service businesses alike.
Platforms such as Placer.ai provide advanced analytics that helps businesses analyze customer visits, assess store performance, and gain deeper insights into consumer behavior. This data-driven approach assists retailers in selecting new sites that align with their target demographics and maximize foot traffic.
Zoning regulations determine what types of businesses can operate in specific areas, dictate building specifications like size and parking requirements, and even control signage rules and public access standards. For example, commercial zones typically allow for retail stores and offices but may restrict heavy manufacturing or other industrial activities.
Compliance with local zoning laws is essential to avoid legal complications and ensure that all necessary permits and licenses are obtained. That includes, of course, keeping up with any updates to those laws, as it happened recently in Fairfax County, Virginia, where they proposed changes to zoning laws for data centers, focusing on issues like equipment screening, noise levels, and size limits–in an effort to balance development needs with community concerns and environmental considerations.
Similarly, initiatives like Boston’s Squares + Streets plan are creating new zoning districts to encourage mixed-use developments and convert office spaces into residential units–with the hope of boosting housing availability and economic vitality in urban areas.
Retailers are focused on achieving long-term objectives such as revenue growth, increased customer satisfaction, and expanding into new markets.
As their ability to achieve those goals depends heavily on the viability of the retail site they choose, it’s no surprise that they use data-driven tools to help them make sense of every aspect of site selection:
Advanced spatial analytics and data science techniques help make sense of all of the above and other spatial data points, such as credit card spending patterns, human mobility trends, and social media sentiment–all trends that can determine your business’ sustainable growth.
Artificial intelligence and machine learning can also help retailers create accurate site models, predict sales performance, and minimize risks associated with real estate investments–while Geographic Information Systems provide detailed insights into local demographics and consumer behavior patterns.
When all these new technologies come together, retailers can stay ahead of the curve in determining the viability of any new sites in achieving their long-term business goals.
Using Maptive for retail site selection allows you to comprehensively analyze potential locations, customize your maps for clear visualization, and effectively share your findings with stakeholders.
Using the Territory Tool in Maptive allows you to create, customize, and analyze specific areas of interest or sales territories, enhancing your strategic planning and decision-making processes.
Fred Metterhausen is a Chicago based computer programmer, and product owner of the current version of Maptive. He has over 15 years of experience developing mapping applications as a freelance developer, including 12 with Maptive. He has seen how thousands of companies have used mapping to optimize various aspects of their workflow.