A slope map is a type of topographic map that displays the steepness or degree of incline of the terrain. It is commonly used in various fields such as geography, urban planning, and environmental science. The challenge of creating a slope map lies in precisely translating the subtle variations in surface elevation and steepness into a visually accessible representation that’s easy to understand.
To answer the question of what is a slope map, we need to first understand that slope is a fundamental topographical characteristic that can influence everything from urban planning to environmental management. For example, while flat land is easier to develop for urban and suburban living, sloped terrain might be ideal for other uses, and often that’s determined by topographic data that informs users of the varying elevation. Steeper slopes might be ideal for terraced farming, but the unique geography, topography and steepness of an area might render it the best candidate for the construction of reservoirs and dams since they leverage the gravitational force of sloped landscapes for efficient water storage and distribution.
Slope Maps vs. Topographic Maps
Topographic maps and slope maps serve distinct purposes and employ different visualization techniques.
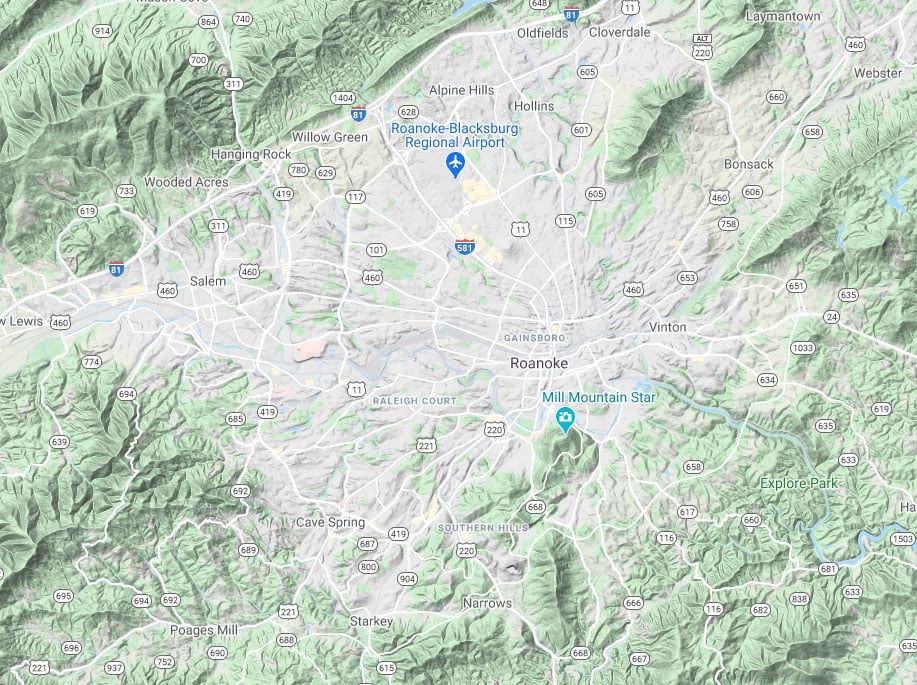
- Topographic maps are designed to depict the shape of the Earth’s surface comprehensively. As such, they often include detailed information on mountains, valleys, and various landforms. However, while topographic maps use contour lines to connect points with equal elevation from sea level, they do not visually communicate the steepness of slopes.
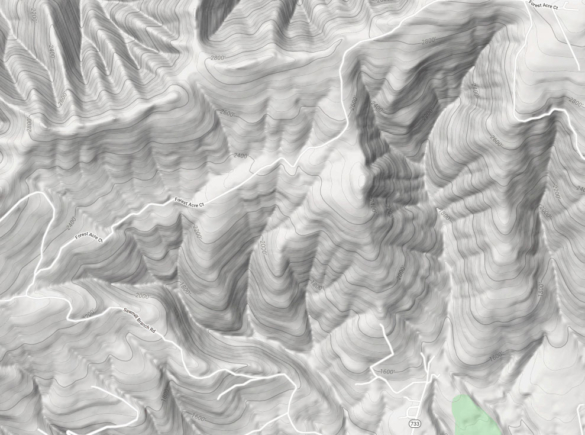
- Slope maps are specifically crafted to highlight the incline and decline of the terrain through color gradients, shading, or numbers. Their primary purpose is to make slope angles or percentages easily understandable so that users can quickly determine potential risks and opportunities.
In essence, a slope map can be considered a tailored version of a topographic map, honing in on the specific aspect of terrain defined by steepness. Both tools contribute significantly to understanding the physical landscape, yet their nuanced differences make them suitable for distinct applications.
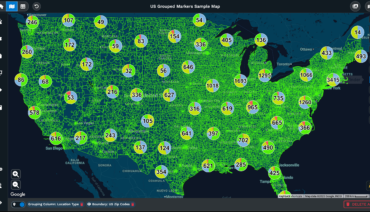
City planners, environmental scientists, or business strategists often rely on mapping software like Maptive to translate geographical data into easy-to-use visual representations. With its user-friendly interface and robust features, Maptive enables users to easily create and use a slope map, facilitating a deeper understanding of terrain variations.
Key Components of a Slope Map
- Elevation data: essentially, precise measurements of ground height at various points. This is the very foundation of a slope map, typically sourced from Digital Elevation Models (DEMs) or LiDAR datasets.
- Slope representation: the literal essence of a slope map! There are a few common ways to visually represent slopes.
- Color gradients: a popular choice, often using darker colors for steeper slopes and lighter shades for flatter areas.
- Numerical values: detailing steepness angles or percentages at specific locations.
- Shading: this mimics natural light to visualize slope direction and shadows, which helps with 3D perception.
- Hatching: similar to shading, hatching employs lines to convey both slope direction and steepness.
- Legend: while most maps come with some sort of legend or key to understand the scale and symbols used, legends on a slope map also call out how colors and numbers translate into degrees and percentages of steepness and elevation.
Types of Slope Maps and Their Uses
Raster vs. Vector Maps
Raster maps consist of a grid of pixels, where each pixel represents a different slope value. This format is great for handling extensive geographical areas.
On the other hand, vector maps display slope and elevation information in the form of lines and polygons, which makes them handy to visualize steepness ranges or generate detailed overlays.
Specialized Slope Maps
- Slope angle maps display angles as numerical degrees. They are generally best for precise calculations in engineering, construction, or landslide risk assessment.
- Slope aspect maps reveal the compass direction faced by each slope. They are mostly used for solar energy analysis, vegetation studies, or predicting snow accumulation.
- Slope curvature maps show the concavity or convexity of slopes. This helps in understanding drainage patterns and erosion risk for each elevation.
Understanding their Uses
- Construction and Land Development: the steepness and elevation of the terrain is directly correlated with its possible use. In this context, a slope map can help in identifying suitable building sites, assessing the risk of landslides and floods, or planning drainage systems.
- Agriculture and Forestry: some crops grow best in steep terrain with efficient drainage, but others require flat land with an overabundance of water. A slope map is an easy way to assess those land characteristics along with analyzing the risk of soil erosion and even optimizing irrigation plans.
- Environmental Studies: the slope and erosion rates of certain areas serve as a reliable predictor of how suitable a certain habitat might be to plant new forests and repopulate with wildlife.
- Urban Planning and Disaster Management: while several factors go into calculating land use suitability and the risk of natural disasters, a slope map can help identify flood zones, plan evacuation routes, and limit the spread of wildfires.
How to Create a Slope Map with Maptive
- Upload Your Data. Begin by logging into your Maptive account, accessing the map creation interface, and uploading your geographical data.
- Select the Map Type. Choose the type of map you want to create. In this case, opt for a terrain or topographic map to lay the foundation for the slope visualization.
- Generate a Slope Map: Activate the elevation data feature and explore Maptive’s options for terrain analysis or slope mapping.
- Choose Visualization Method. Select color gradients, shading, or numerical representations. Adjust the settings to ensure the visualization effectively communicates the steepness of the terrain.
- Share Your Maps. Export or share your slope map, or even print it. Add collaborators as you wish or embed it on your website and share it on social media.
Brad Crisp is the CEO at Maptive.com, based in Denver, CO and born in San Francisco, CA. He has extensive experience in Business Mapping, GIS, Data Visualization, Mapping Data Analytics and all forms of software development. His career includes Software Development and Venture Capital dating back to 1998 at businesses like Maptive, GlobalMojo (now Giving Assistant), KPG Ventures, Loopnet, NextCard, and Banking.