How can your location data help you maximize revenue, gain a distinct competitive edge, and make more profitable decisions?
Catchment area analysis capitalizes on your location data to help you understand where your customers come from, how they behave, and how to place locations for optimal results. Winning businesses know this: the right location is not just an advantage, it’s an advantage your competition can’t replicate.
Learn how to leverage your best assets, your customers, into an impenetrable edge with catchment area analysis—and how enterprise-level software solutions like Maptive make that process seamless.
Table of Contents
Catchment area analysis, sometimes referred to as trade area analysis, is the process of using location data to understand where your customers come from and how to place locations for maximum mutual benefit.
While used by businesses to grow revenue, catchment area analysis’ combination of efficiency, depth, and data visualization make it a common practice of cities, governments, and public health and safety institutions, too.
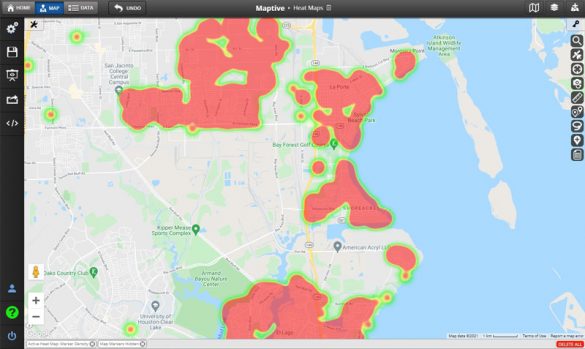
Catchment area analysis visualizes your location and sales data to help you compare your locations with each other, your competitors, and your customer behavior.
Originally used to measure rainfall, a catchment area is a measurement of a geographical area’s population density and traffic. Unlike catchment zones, which are fixed boundaries, catchment areas change with a location’s performance.
Catchment area analysis can have a profound impact on your business. By discovering the immense value hidden in your location data, you gain many major benefits, including:
Catchment areas are defined by the datasets you use: your sales, location, customer, competitor, market data, and more each provide a layer of dimension and accuracy to your results.
Maptive makes it a breeze to calculate catchment areas. Simply upload your Excel Spreadsheets or Google Sheets to transform your massive data into an intuitive and beautiful custom Google Map.
And with rich features like the Filter Tool, you can navigate layers-upon-layers of actionable data to uncover your most impactful insights and discover hidden opportunities. Start your free trial today, no credit card is required.
However, catchment data analysis is most effective when complemented with trade area analysis, which focuses on quantifying your customer’s behavior and movement to help you make more informed decisions.
Understand how—and how long it takes for—your customers to reach your locations, predict foot traffic volumes, and increase accessibility, with drivetime/walk time analysis. This analysis, which uses GIS data to measure how easy it is for your customers to reach your location, is among the best resources available when determining the location of new stores.
Looking for even deeper insights? Pair your customer demographics—made easy with Maptive’s Demographics/US Census Mapping Tool—with mobility pattern data to learn how your customers behave at a deep and detailed level.
Maptive integrates these abilities for you, teaming industry-leading proprietary features up with the reliability and real-time data of Google Maps API—eliminating the need for additional software.
Catchment area analysis involves several steps, from compiling data to executing big decisions. And while the process is involved, the results are very well worth it. Furthermore, software like Maptive simplifies much of the process, so you can reap the rewards faster.
Catchment area analysis is one of the smartest, most efficient, and most complete means to making intelligent location-driven business decisions.
Unlocking the power of your location, sales, and customer data through data visualization, catchment area analysis maps a real-time picture of your organization’s health—while highlighting exactly where you need to be to win customers and beat your competition.
Understand where your customers are, how they move, behave, and shop, and how you can optimize your locations to generate revenue and increase profitability. The benefits are clear:
If you’re an organization ready to make data-backed, informed, and impactful decisions about your locations, sign up for your free, no risk, 10 day trial of Maptive today. With the features and ease-of-use you need—and the immediate results and hands-on support you want—Maptive makes growing your business with catchment area analysis effortless.
Brad Crisp is the CEO at Maptive.com, based in Denver, CO and born in San Francisco, CA. He has extensive experience in Business Mapping, GIS, Data Visualization, Mapping Data Analytics and all forms of software development. His career includes Software Development and Venture Capital dating back to 1998 at businesses like Maptive, GlobalMojo (now Giving Assistant), KPG Ventures, Loopnet, NextCard, and Banking.
