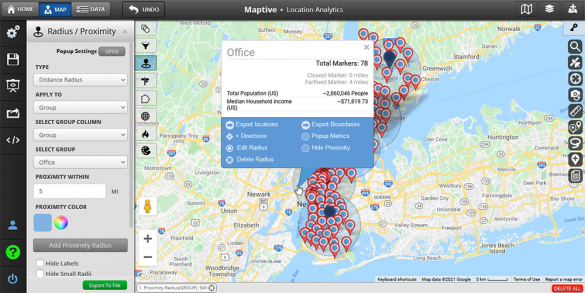
Is your business getting every insight it can from your data? If you’re like most businesses relying solely on charts, graphs, and tables for analysis, the answer is “no.”
Hidden in your data is a massive opportunity: location data. Tap into your location data the right way, a process known as location analytics, and you gain an immediate edge over your competition.
Location analytics utilizes your business’ data to deliver deeper insights than traditional analysis ever could—and when conducted through a fluent GIS mapping software like Maptive, faster and more comprehensive than you ever thought possible.
In this post, you’ll learn how to deploy location analytics with Maptive to access complete, intelligent business insights—before your competition catches on.
Table of Contents
Location analytics, also known as geoanalytics, applies location data to traditional analysis to gain deeper, more valuable insights.
Often implemented by large enterprises with multiple locations, location analytics visualizes layers of actionable data and insights through mapping software.
Location analytics is used primarily for strategic purposes. The practice extracts insights and context other methods can’t, making it ideal for companies that require substantial business intelligence to make critical decisions.
Any organization with multiple locations or geographically dispersed customers may benefit from location analytics. While use cases are specific to each industry, the sheer concentration of valuable information in geoanalytics data makes location analytics an asset for virtually every department.
The benefits of location analytics extend to any organization—business or otherwise. For example:
There’s no doubt about it: adding location data to your business’ analysis adds a dimension that’s greater than the sum of its parts. However, that doesn’t imply that all location analysis tools are created equal. In fact, it’s quite the opposite.
To get the most out of your location analytics, certain capabilities are non-negotiable.
Combined with its intuitive interface, full-customization, and enterprise-level mapping technology—powered by Google Maps, Maptive integrates each of these key capabilities, and more, into a robust location analytics software. Try Maptive for free today.
Heat Mapping
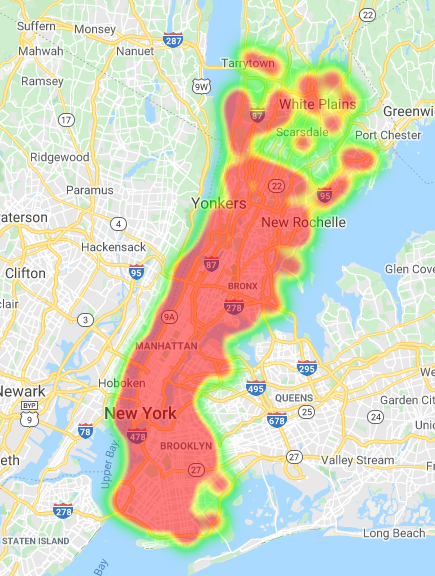
Beautifully visualize your sales and population density data to uncover geographic insights. Businesses trust Maptive’s heat-mapping tool to track top-performing markets, identify opportunities, and much more.
View Marker Data
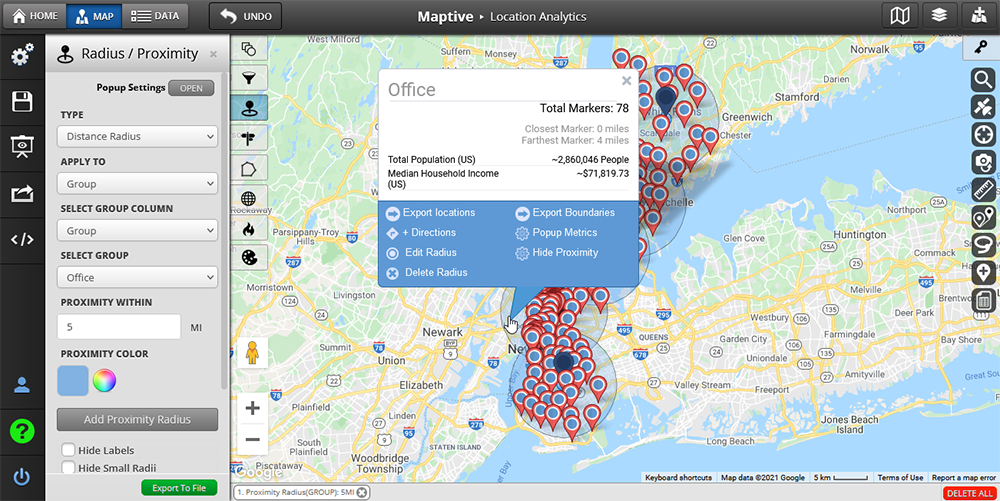
Get concise breakdowns of each location’s critical data with Maptive’s pie chart clusters and markers tool. This tool plots your locations as easy-to-interpret pie charts to process large volumes of data quickly.
Powerful Boundary Features
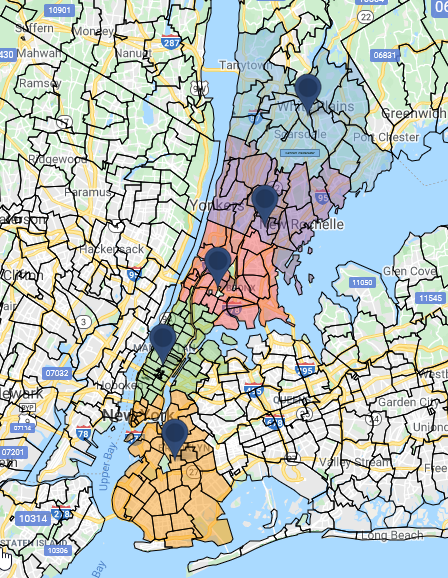
Maptive’s Geographic Boundary Territory tool makes it easy to define, divide, and color-code your business’ territories—by county, state, zip code, and more—for more efficient regional location analysis. You can even create custom boundaries with the Polygon Territory Tool.
Demographics & US Census Data
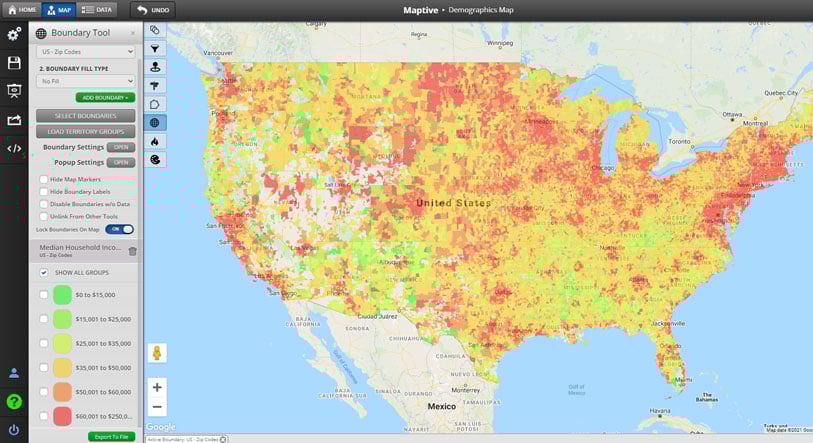
Boost your marketing and decision-making with demographic insights provided by the U.S. Census. Maptive lets you access population data straight from the software, including population density, age, median household income, race, education, and more.
Custom Grouping Capability
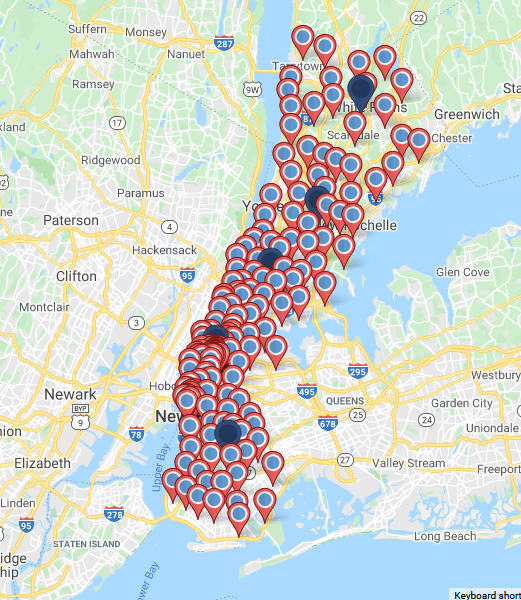
Transform your data into data-rich markers. Maptive’s Group Markers by Color Tool color-codes your locations for simplified sorting. At the same time, the Multiple Grouping Tool turbocharges your markers—allowing you to adjust by size, color, and more—for even more insightful mapping.
Fully Customizable Maps
Maptive sets itself apart from the pack with its fully customizable and configurable interactive maps—including the ability to upload custom branded assets, save specific views and zoom levels, and take complete creative control over your presentation-ready maps.
Utilizing Maptive for location analytics is the ultimate competitive advantage, leveraging data you already have into a comprehensive, complete, and fully custom interactive map in a matter of minutes. Want to receive deeper business insights faster than your competition can keep up? Start your free, no-risk, 10 day trial of Maptive today.
Brad Crisp is the CEO at Maptive.com, based in Denver, CO and born in San Francisco, CA. He has extensive experience in Business Mapping, GIS, Data Visualization, Mapping Data Analytics and all forms of software development. His career includes Software Development and Venture Capital dating back to 1998 at businesses like Maptive, GlobalMojo (now Giving Assistant), KPG Ventures, Loopnet, NextCard, and Banking.
